

Hounsfield's sketch
In 1967 an idea occurred to Sir Godfrey Newbold Hounsfield (1919-2004), a brilliant English electrical engineer, that one could determine what was inside a box by taking X-ray readings at all angles around the object. Prior to this he was involved the development of early computer technology where in the late 1950s he had lead a team that built the first all-transistor computer to be constructed in Britain, the EMIDEC 1100. Combining his knowledge of computer technology and his interest in automatic pattern recognition, Hounsfield’s realisation lead to his invention of the computer tomography (CT or CAT) scanner. Bizarrely his invention is also attributed as a direct result of the Beatles booming record sales in the early 1960s. It turns out that the EMI record company, an arm of the EMI Group (Electric & Musical Industries Ltd) also owned the Central Research Laboratory in London of which Hounsfield was an employee. Benefiting from the Beatles lucrative success EMI was able to fund Hounsfield’s pioneering work on this scanning devise for which he was awarded the Nobel Prize in 1979. EMI produced and marketed the first commercial scanner. (principles of Biomedical Infomatics Ira.J.Kalet, Academic Press Elsevier 2009 pg 44-45 )
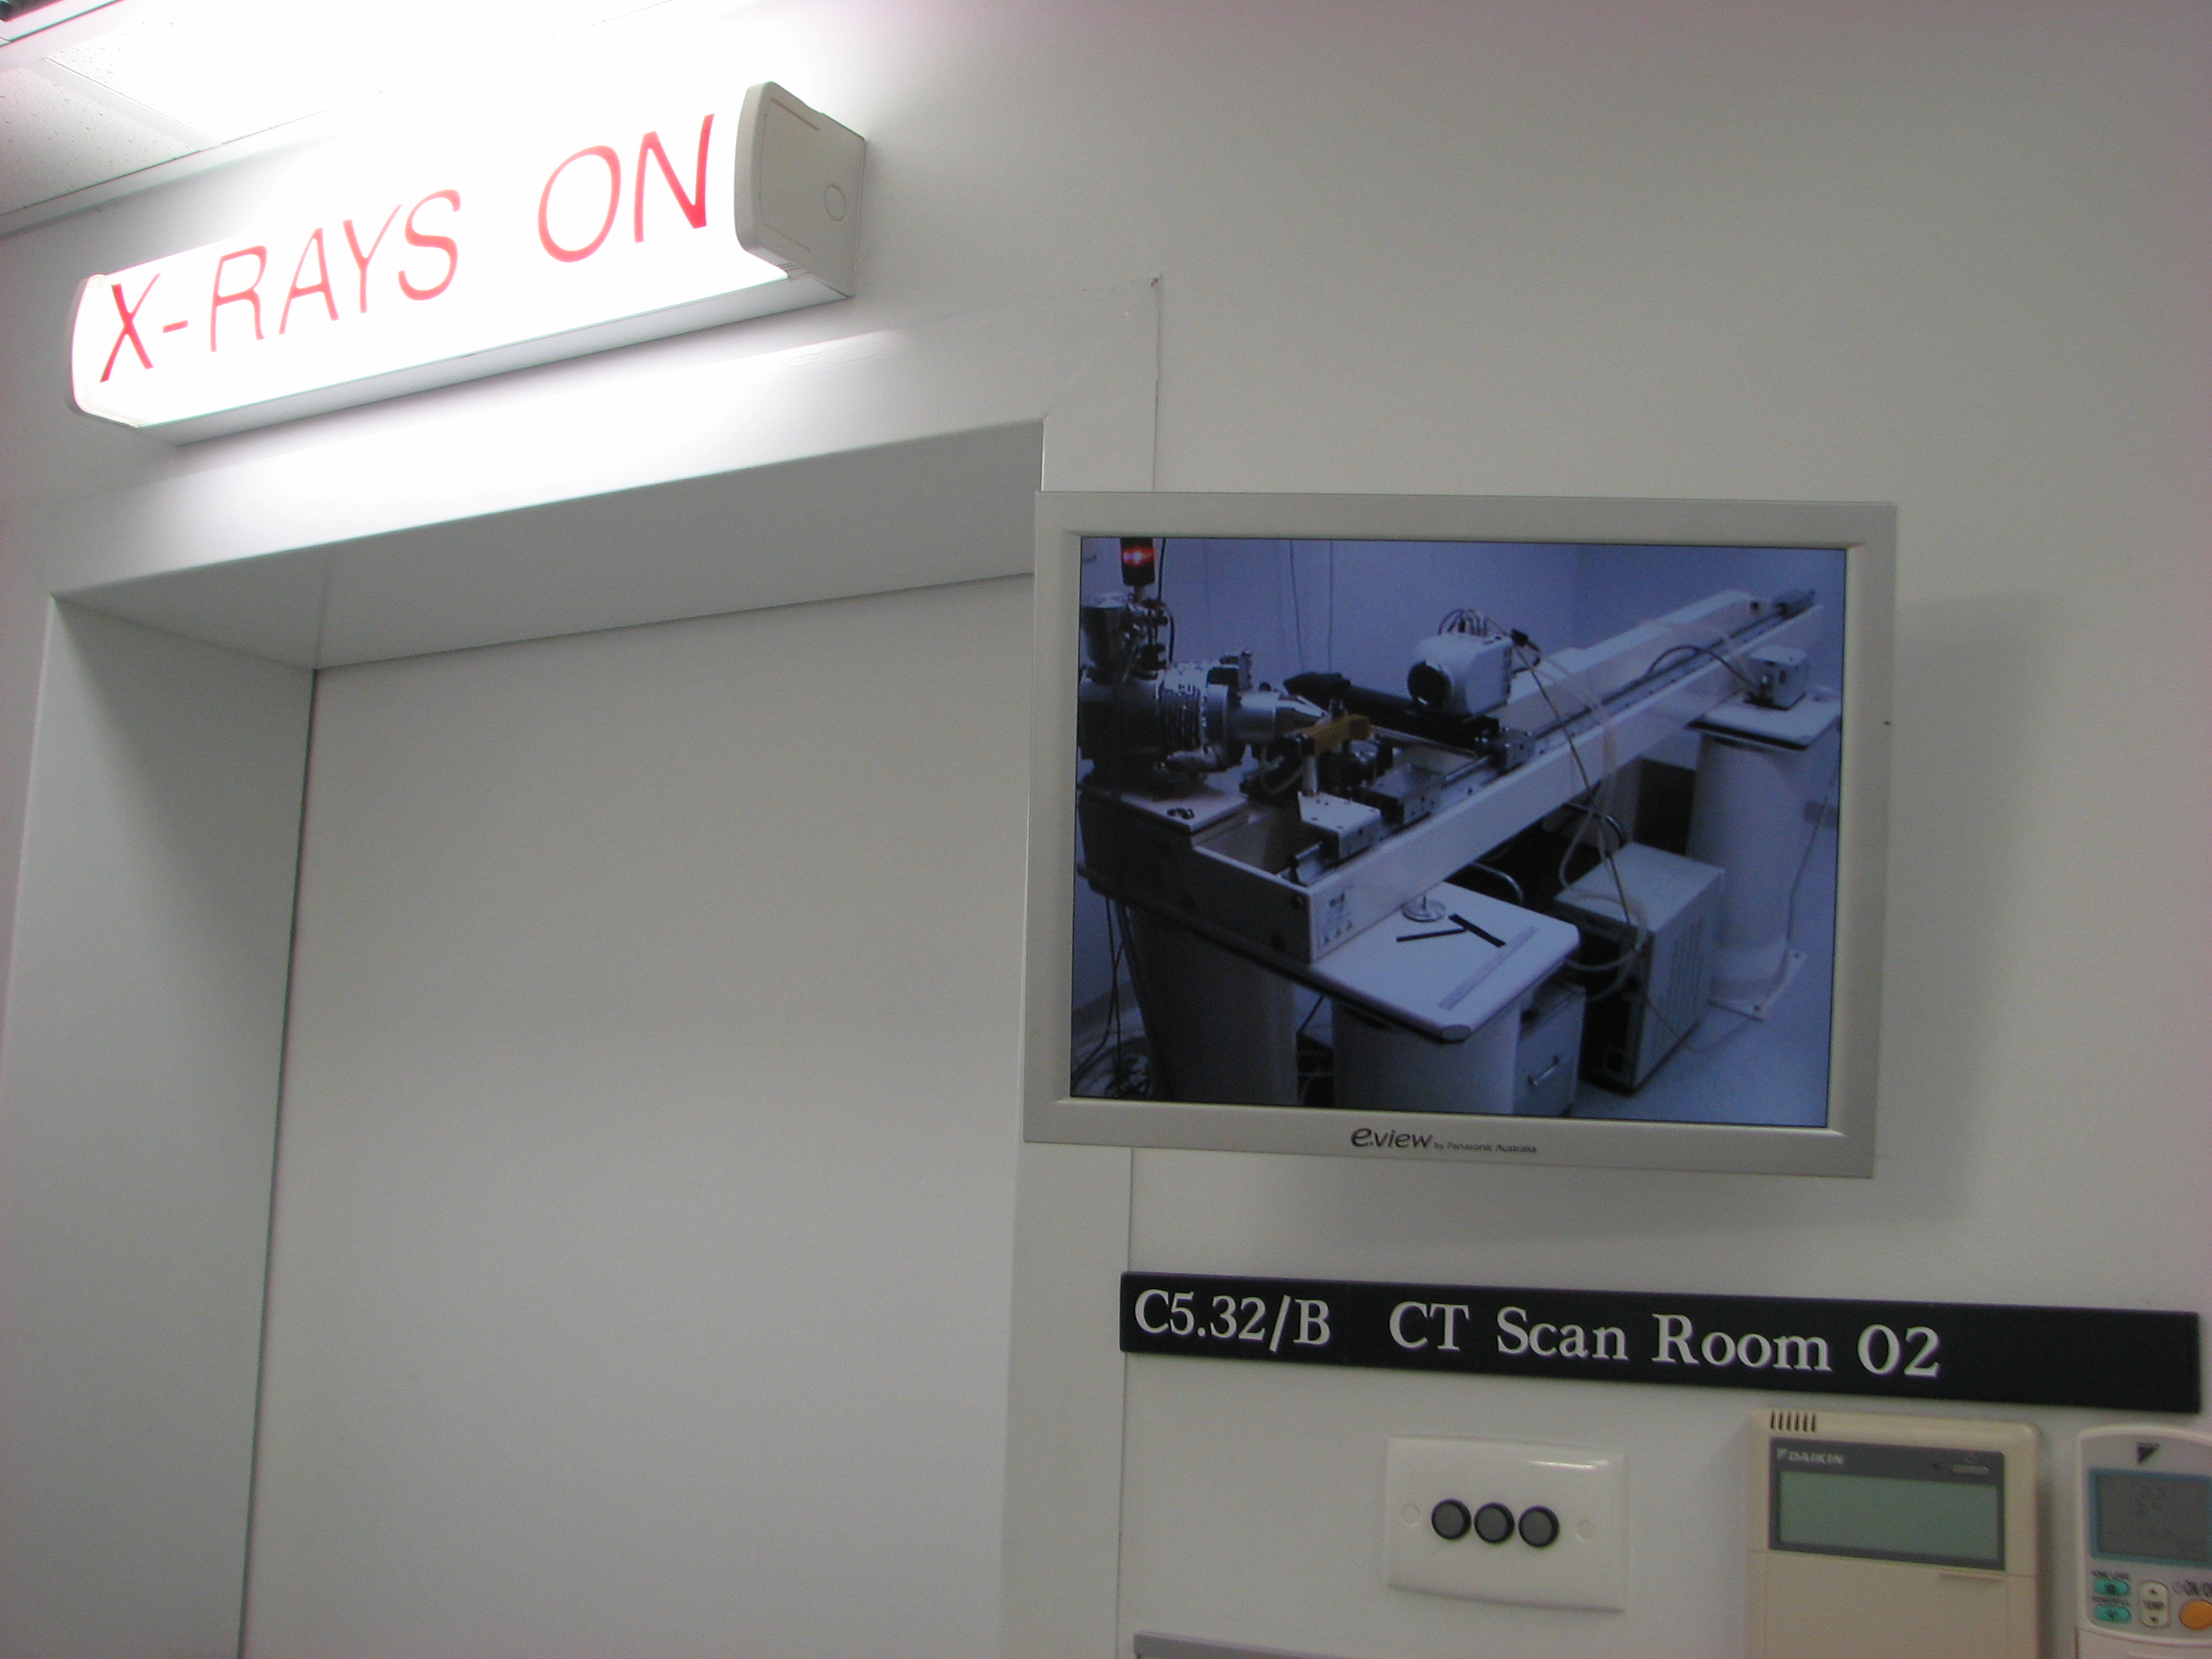
ANU XCT Facility micro-CT scanner.
Since then computed tomography scanning has revolutionised medical imaging and diagnostic radiology methods; we are now familiar with the images of body parts in thin slices. More slowly technology entered research laboratories, particularly those focussed on the structural studies of materials. While simple realisations of the internal structure in rocks, fossil and animals proceeded for many years, the novel developments of tomography such as 3D micro-CT were imagined but not fully realized until a major revolution in computational power. Now supercomputers make it possible to image high-resolution volumetric data quickly, so this nuclear optic technology is advancing at a rapid rate. The microcomputed tomography in the ANU Department of Applied Mathematics is a modern day extension of Hounsfield’s CT and computers, only this new technology give us the ability to visualise a full dataset extremely quickly.
work in progress, animation in 4 revolutions - hyperlinked: click through to movie
Each micro-CT dataset of the growing mung bean is one revolution, a full 360 degrees. Andrew Kingston has processed more revolutions from every three steps so I can put them together as an animation and have a look at how this project is going to work as a sequence of successive revolutions over the nine-hour period. 3D micro-CT is tomography created through computer processing of digital geometry to generate a three dimensional image of the internal and surface areas of a static object X-rayed around a 360 degree rotation on a fixed axis. It results in high resolution 3D volumetric data represented by voxels or points mapped within x, y and z coordinates, a single dataset can contain up to twenty gigabytes of information. This is what gives me the full volumetic image of the bean seed.
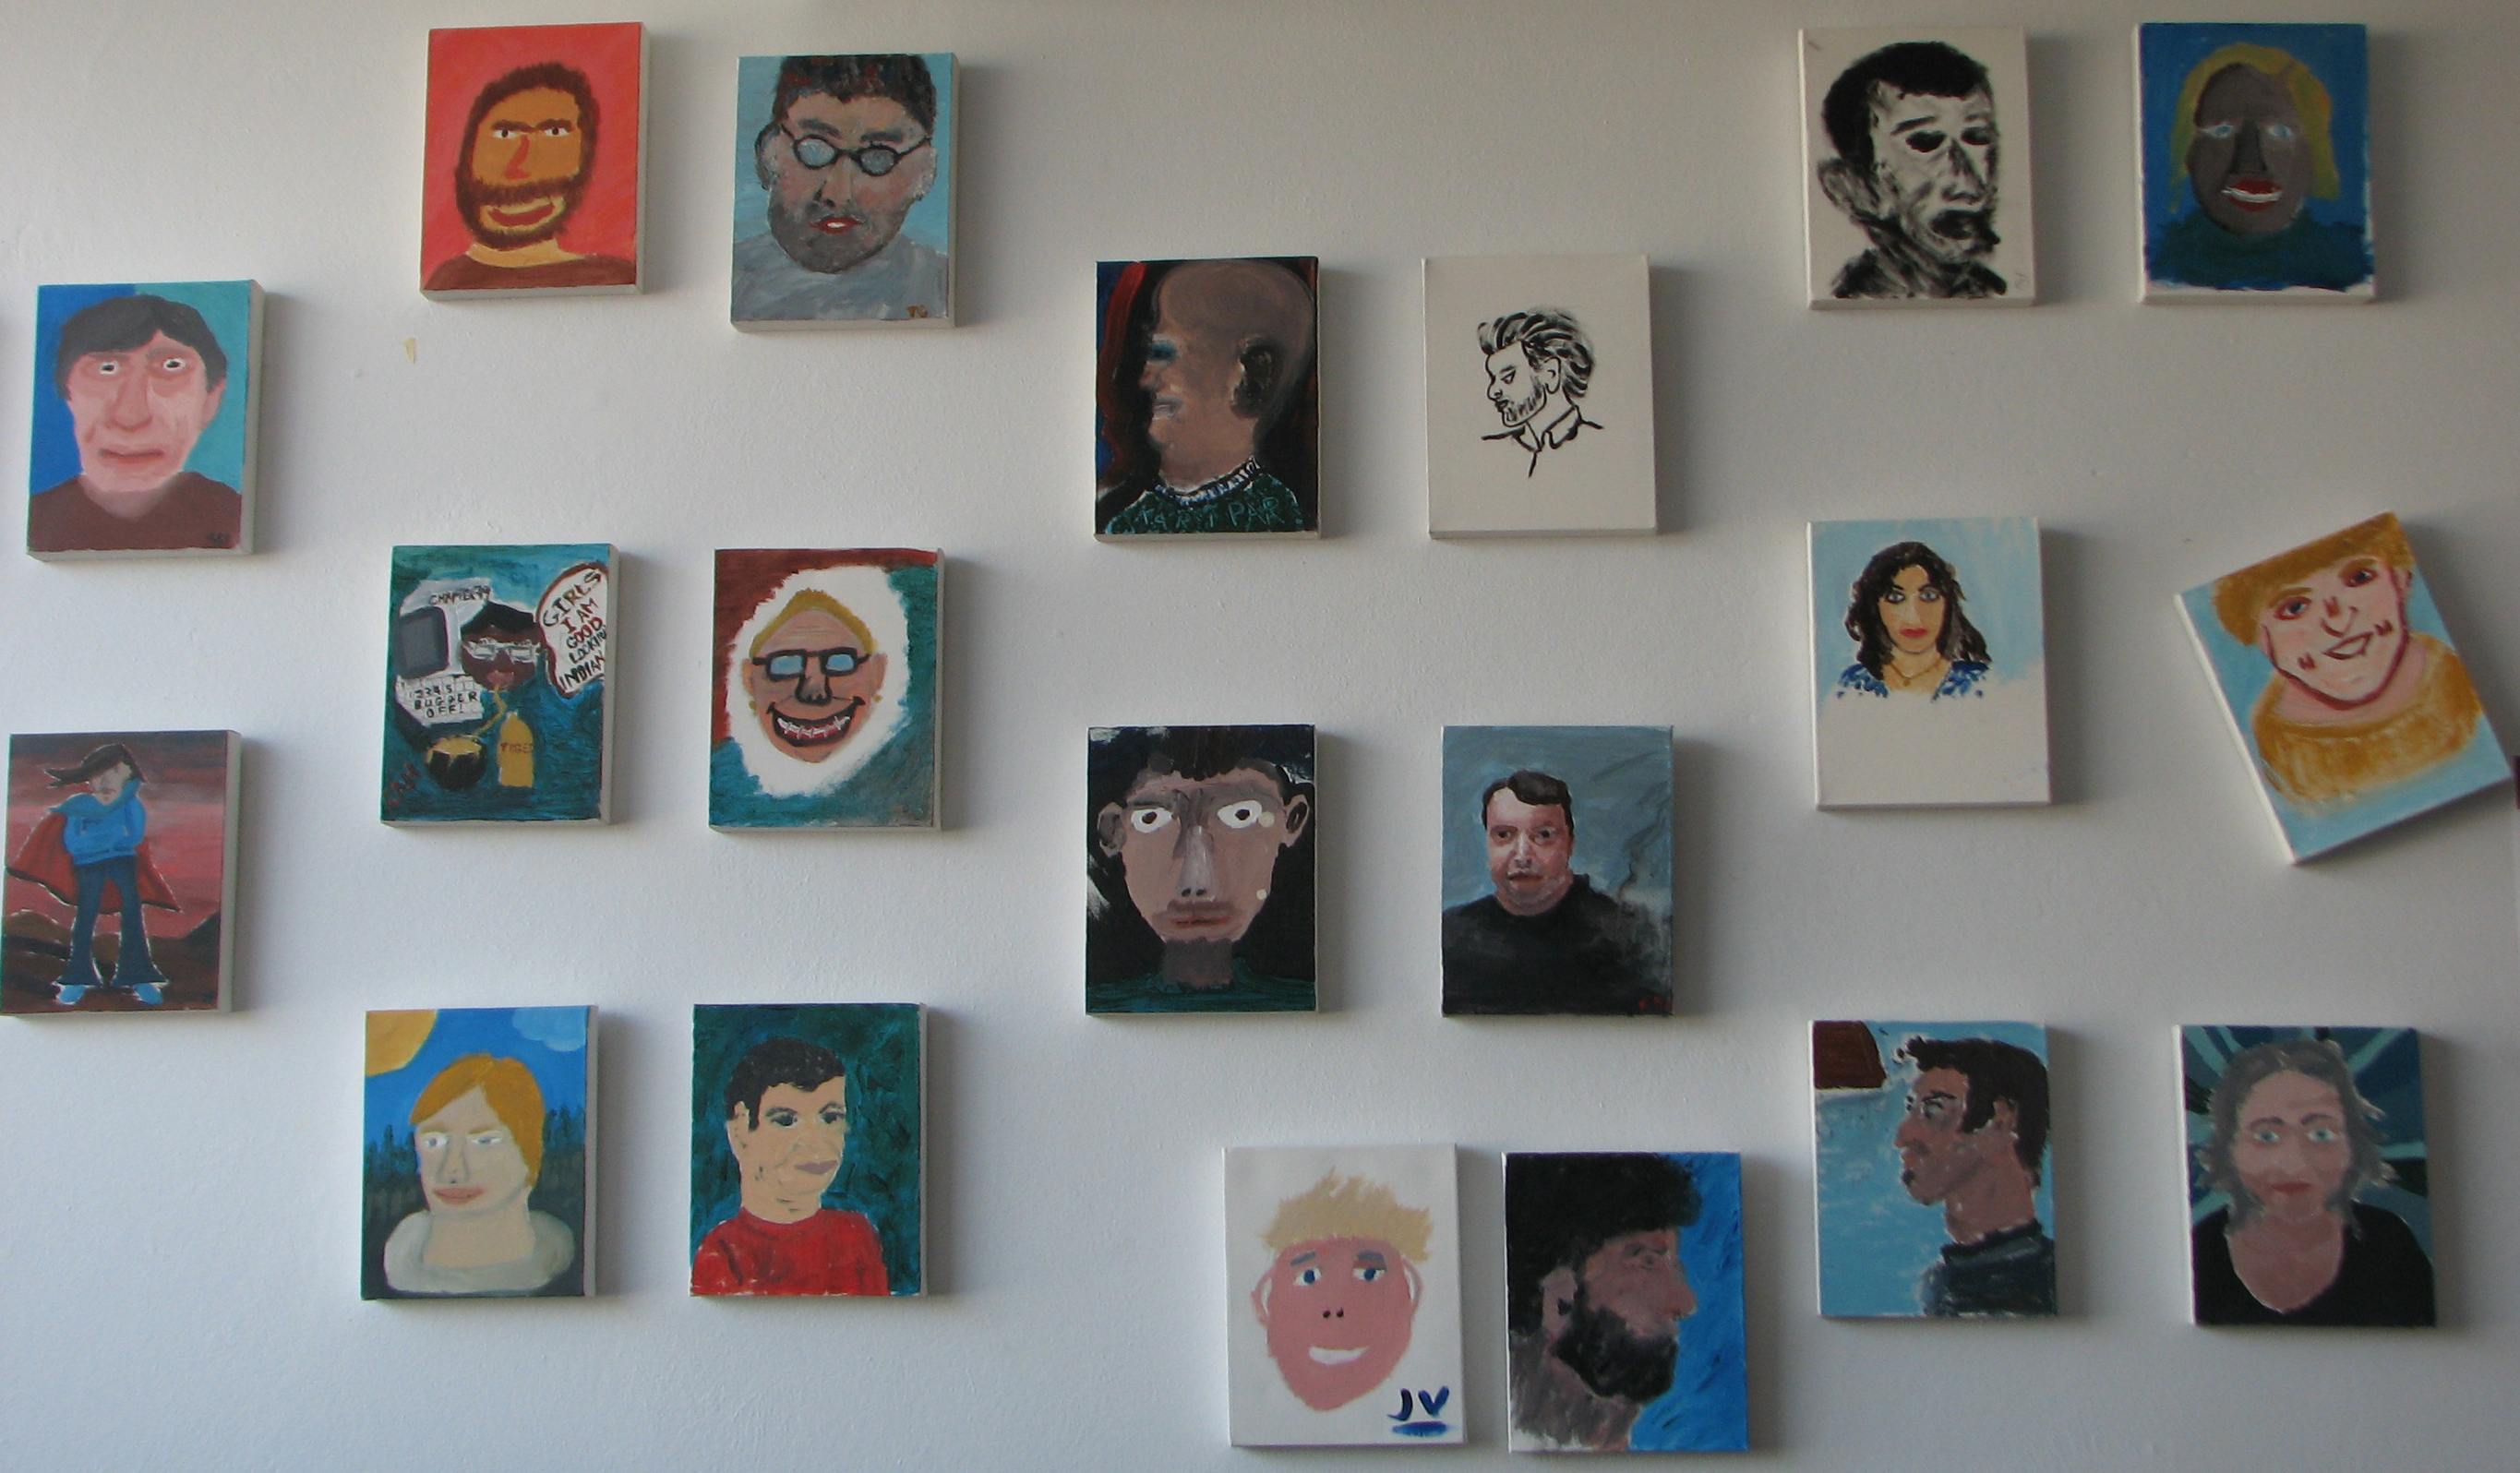
Portraits in the tea room. A small selection of the many characters from the ANU Department of Applied Maths, as a painting of each other.
I’ve tried to understand this process a little more. While I’m just an end user I think it important that I familiarise myself with this technology and how it works. I’m privileged to work with the team at Applied Maths. They all have brilliant minds and slowly as I get to know them better I find out that they have done something extraordinary; discovered something, worked on a groundbreaking project or won some major award, yet their achievements remain understated. As a Department they are very inclusive, fun, enthusiastic and it so amazing the way they put up with me hanging around and share their ideas. Conversations vary and I often get a full explanatory diagram drawn on the white board; such as the instructional chat I had with Adrian about the physics of heat loss in a cup of coffee – does it cool quicker with milk in or not? – or the theory and process involved with the technology they are using so I can get up to speed with my project.
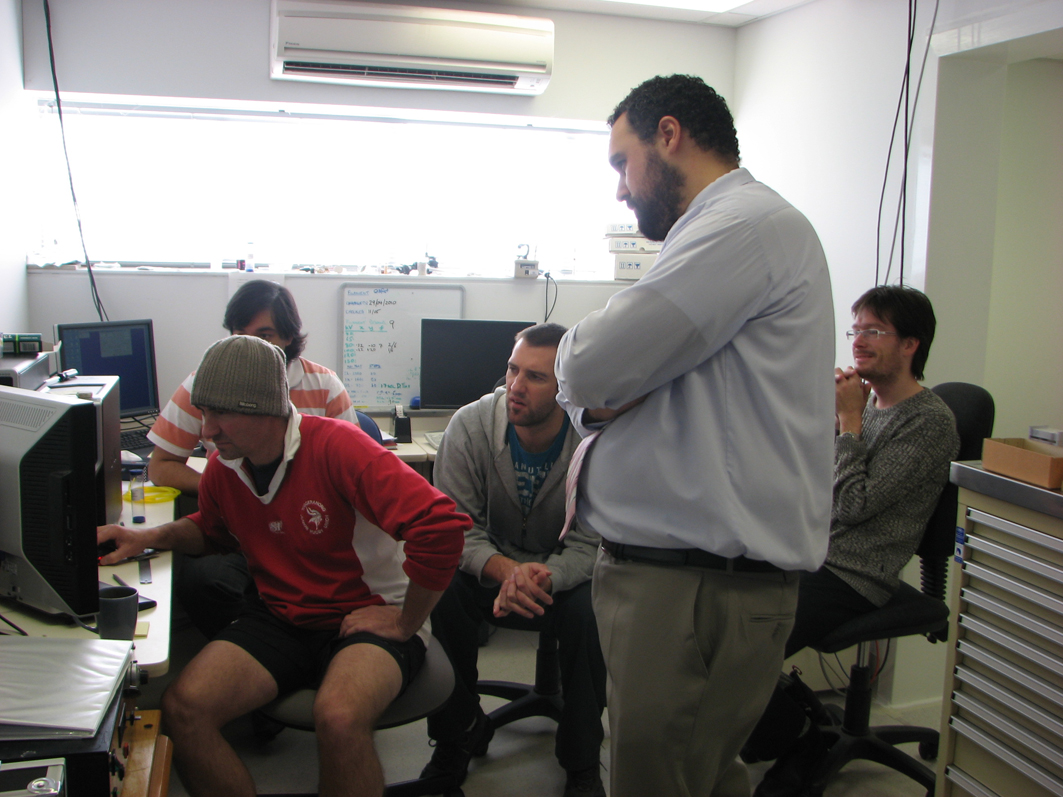
M.Turner, G.Myers, A.Kinston, B.Young (standing) and T.Varslot
The people I have most contact with in regards to the XCT, apart from Tim Senden is the group in this photo, Michael Turner, Andrew Kingston, Glen Myers , Trond Varslot and includes Ben Young (from Digital Core). They make up part of the group that are looking at Dynamic XCT which is an image in 4D (3D + time). This major project is confidential as they are looking toward establishing a patent for the rapid acquisition of data in 4D. They would have to kill me if I told you about it. Luckily for me it is so complicated that there is little chance of me ever understanding the technical aspects of it, so I am no great risk …
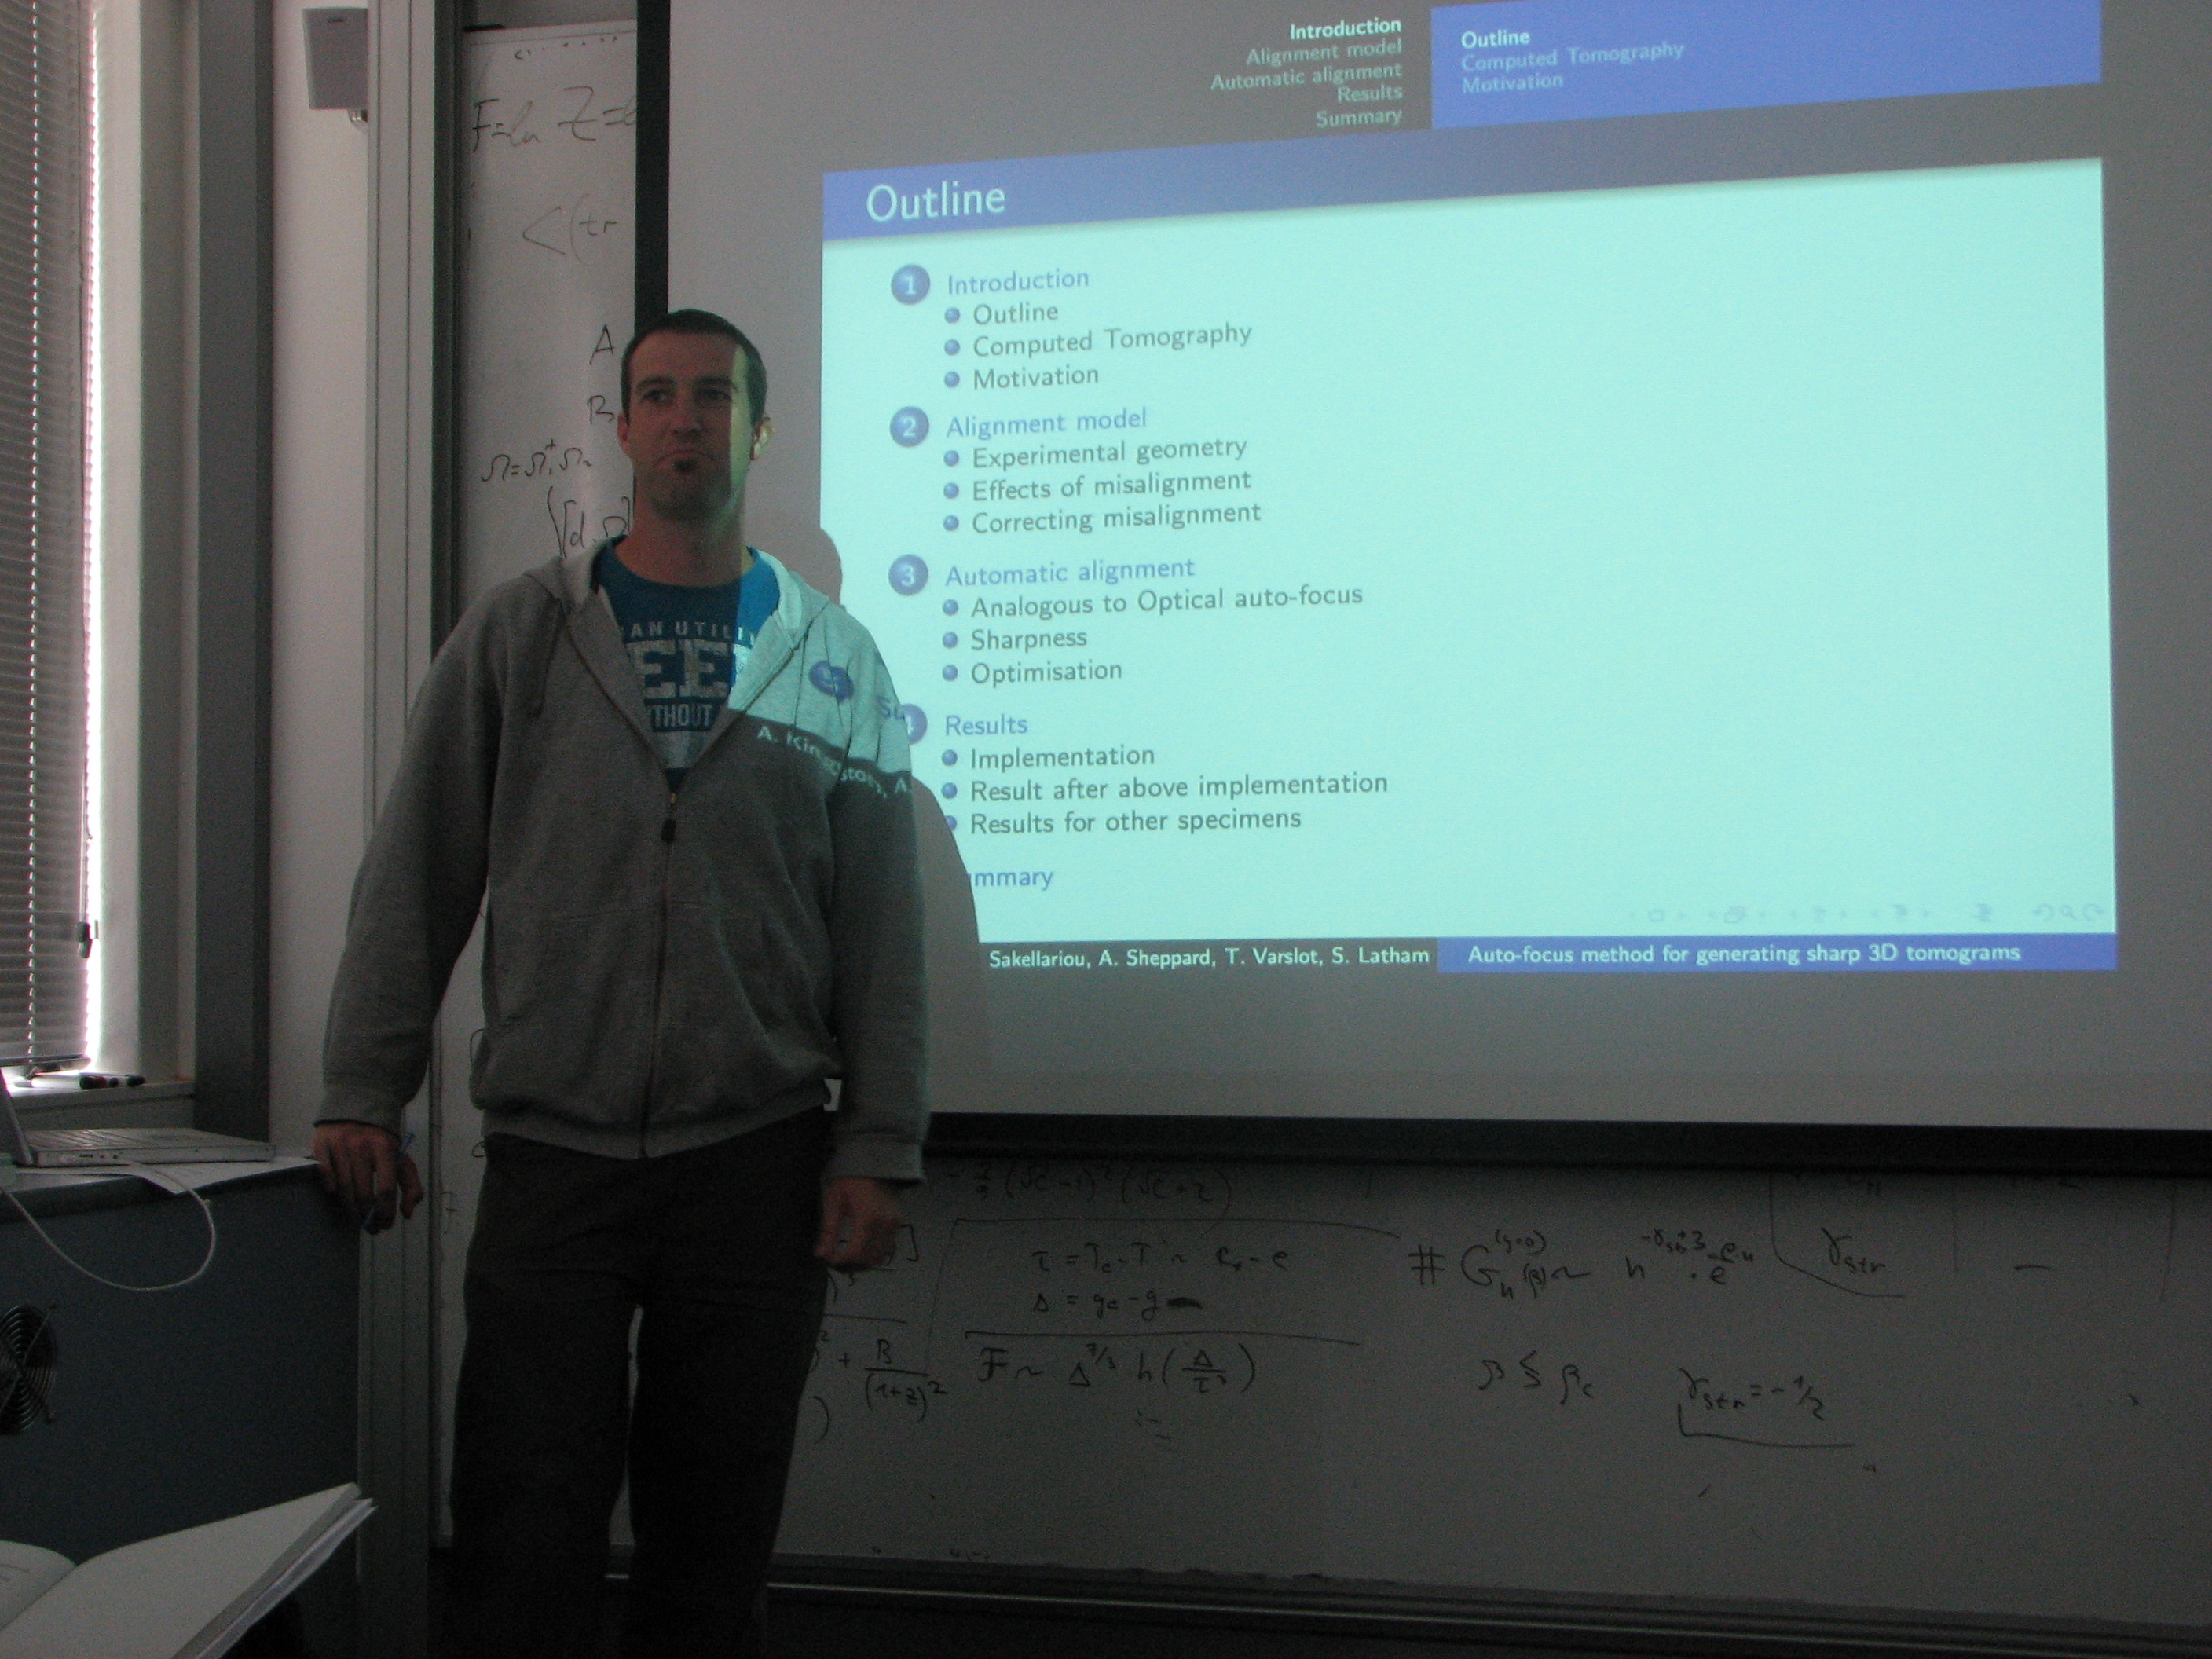
Andrew Kingston briefing the troupes
Recently Andrew and Trond gave a presentation to the department on the research they have been doing in regards to the software that interprets and represents the tomography images, mostly of rock core samples around 5mm in diameter. It gave me a better understanding of what they are working on in terms of image resolution. Because the object is scanned by a cone of X-ray as it rotates 360º, there is a distortion of the resulting 3D data. Because of this they are developing software to correct the data so that it becomes a true volumetric representation of the original sample.

pinhole cameral negative 1986
To comprehend I correlated this idea to making pinhole cameras in first year photography; placing fresh light sensitive paper in the back of a shoebox, finding a subject in the light, unveiling the pinhole, capturing the image by guessing the exposure time, stopping the pinhole and racing back in to the dark room to develop the negative. My images were fairly rudimentary, resulting in circular images shaped by the light refracting inside the box through the pinhole. A small section in the middle of the image is in focus but bleeds out of focus toward the edges. The way I can understand Tron’s and Andrew’s software is that if you pretended to use their software to process these old pinhole photographs, (if you imagine that the paper stores the image as data) their software would rectify the data at the edges and bring the whole image into crisp focus. Another way for pixel people, like me, is thinking of the problem as you would in Photoshop. Imagine you have an even grid of lines and you overlay another grid of lines that have been spherised in the distort filter tool. Only the middle to the two grids align exactly. You would need to use the transform tool to rescale the warped grid to match exactly the even grid behind.
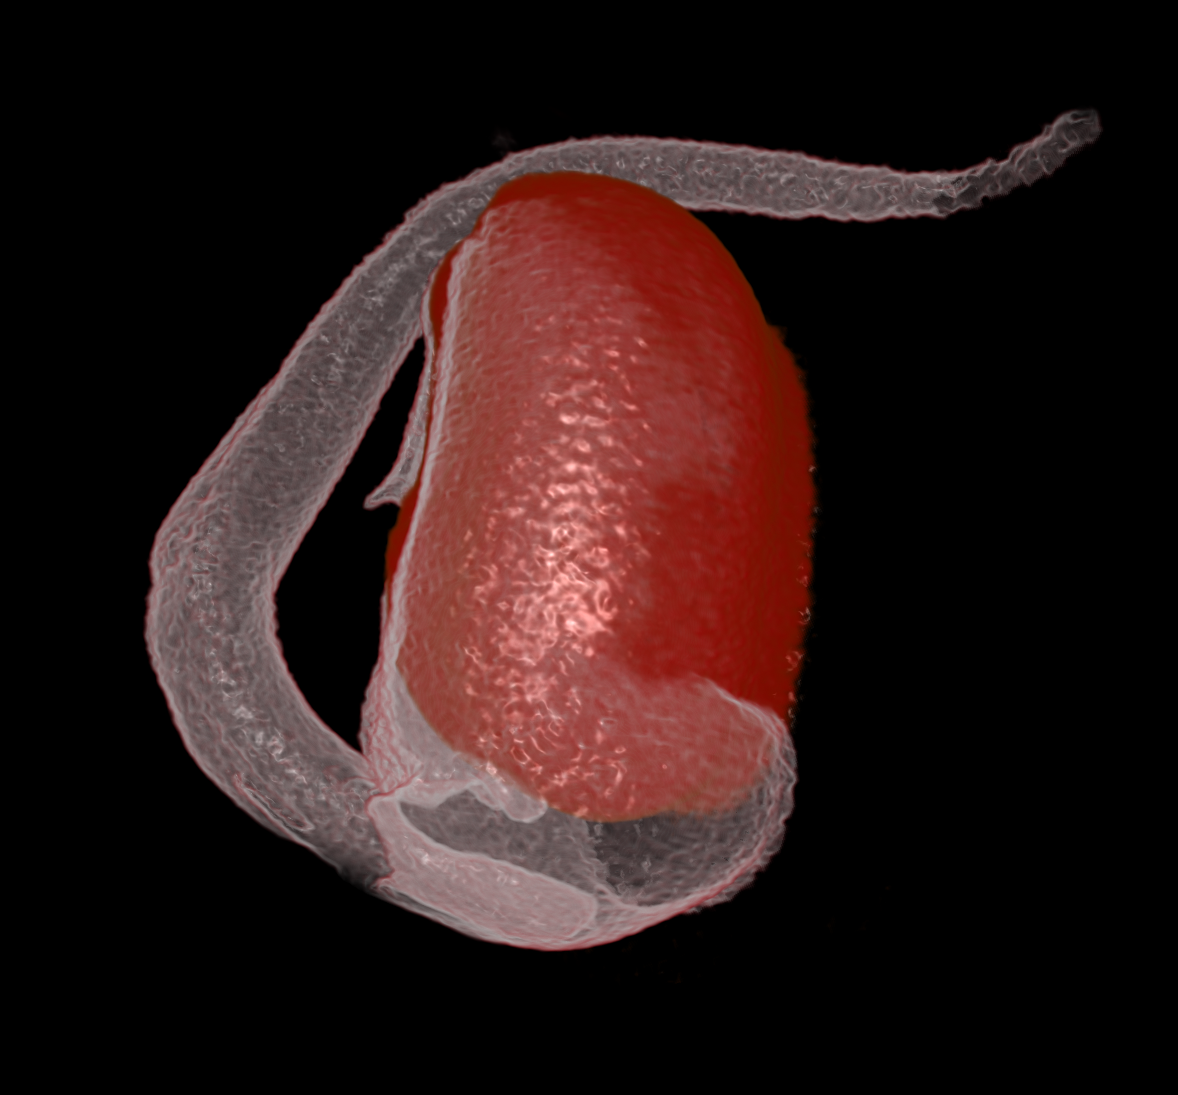
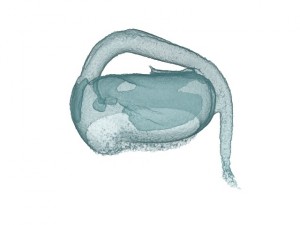
mung bean seed germinating - work in progress
Of course using the example of a shoebox pinhole is a dreadful over-simplification considering they are looking at 360º volumetric datasets with applied mathematics, but its interesting to note that with this software they can now look at old data sets that predate the software and rectify them in the same way. But it is not a simplification to admire 3D micro-CT scanners as an advanced form of digital photography, because that is what they are. They use light – which in this case is X-ray – to capture the information that makes up an entire object, and it records this information through a tightly packed core of optical cables. The tricky bit after data collection is the reconstruction or synthesis of this data into a 3D image, and then the segmentation which is the interpretation of this 3D image by a computer. These phases are important so as to differentiate the various aspects of data such as solids, liquids, gas or air, as a process of improving the clarity and contrast of the data.
All this combined results in these images of a sprouting bean.