from the other side…

Pflanzenwachstum (Growth of Plants) 1921 Paul Klee

Where’s Mr. Plattner? That was a question that was to be repeated many times in the next few days. It really seemed as though that frantic hyperbole, “blown to atoms,” had for once realised itself. There was not a visible particle of Plattner to be seen; not a drop of blood nor a stitch of clothing to be found. Apparently he had been blown clean out of existence and left not a wrack behind. Not so much as would cover a sixpenny piece, to quote a proverbial expression! The evidence of his absolute disappearance, as a consequence of that explosion, is indubitable.

So writes H.G. Wells in 1886 of the disappearance of Mr Plattner who, after a chemical experiment gone wrong, was blown through the fabric of reality and into the green haunted space of the fourth dimension. For nine days Mr Plattner experiences the life through the transparency of the ‘other side’. He returns to reality with every atom of his body reassembled in the mirror image of his former self; even his heart sits to the right.

Thus H.G Wells describes the curious search for critical evidence to prove the existence of the fourth dimension in the late 19th Century. There are many imaginative references to this new concept in the literature of the time. But I like particularly this early portrayal of virtual reality. The re-composition of Mr Plattners material body in reverse is interesting to consider.

Such is the volumetric nature of my sprouting beans, they are virtual copies of their former selves, suspended in an artificial space. Time is the added dimension. In the last few months Ajay has created an an excellent solution by interpolating one volume to another to get an illusion of seed growth. I have started to put together some really nice animations that will begin to give us an idea of what the final work this work might eventually look like. This is truly a work in progress.  Bean movie at Vimeo

But I haven’t disappeared. It is just time and lots of it, which this project requires. So while I officially close this blog at the end of my residency, my project continues to thrive. A huge thanks to ANAT and their assistance with this project as the support of this Synapse residency has spun me on an excellent trajectory. I am continuing to investigate GROW: visualising nature at nanoscale, as a PhD candidate at the ANU School of Art Photography and Digital Media Workshop in collaboration with Prof. Tim Senden and the team at the Department of Applied Mathematics.

To read more about this project you can go to my website  www.ericaseccombe.com.au


Posted in project | Leave a comment

birds eye view…

Day of the Triffids. Image from the BBC series (1981) based on the science fiction novel (1951) by John Wyndham about a marauding gang of intelligent but aggressive bioengineered plants.

The first day I arrive at the High Resolution Plant Phenomics Centre it is a glorious spring morning. It seems hard to believe that we have just lived through the last seven years of drought. Everywhere is green and even the lawns are lush, covered in a blanket of bright yellow daisies. Dr Bob Furbank introduces me to the rest of the team, Alyssa Weirman, Dr Xavier Sirault, Dr David Deerman, Scott Berry, Scott Kwasny, Xueqin Wang and Richard Poiré. First up the indefatigable Frenchman Xavier explains to me in highspeed the mathematics behind the 3D imaging program he is setting up. I then spend the morning with Technical Officer Scott Berry going through a rigorous induction including OH&S, Facility training and before I can become a legitimate CSIRO employee. The HRPPC is a certified PC2 facility and there are strict guidelines to follow, automatic doors to wait for, movement sensor hand washes and colour coded labcoats. The Centre, described as a plant hotel, has a central laboratory is full of large growth cabinets, in which I secretly hope will be full of mutated Triffid like vegetation, but there are a series of very sedate experiments being conducted. Most of the plants I view are scientific modeling plants such as Brachypodium and Arabidopsis. After the overall tour I am introduced to the technology they will let me use.

The High Resolution Plant Phenomics Centre as seen through the Infrared camera, contrasted against the icy sky.

First is the infrared Camera, a FLIR SC660, which is a high performance infrared system used for science and research applications within the long wave spectral range. The smooth, shiny lens on this infared camera is made from germanium, and there are two lenses, one on the outside, one on the interior, and the images are detected through these lenses to third, which is the sensor. Scott gives me an overview of the application settings and explains what I’m looking at, and what effects the images such a emesivity. The Centre has a few different types of infrared cameras, for close-up and aerial shots, and this particular hand held one is worth around $110K. I don’t quite believe they are going to set me loose with it. I hear later in the tea-room that the thermal cameras were developed mainly for military purposes, for night vision or through smoke, but they are now available for industry and science. However, infared cameras with powerful zoom lenses are still unavailable on the market because they are the type that pick up people behind walls before you shoot them. Bob Furbank mentions that when they had some consistency trouble with one of their cameras they took it back to the manufacturer who said they never had this kind of complaint before as this type of camera is usually one use only ie; on the control panel of a missile.

A Predator's hunting helmet increases its ability to see in a variety of spectrums, ranging from the low infrared to the high ultraviolet, and also filters the ambient heat from the area, allowing them to see things with greater clarity and detail.

An objects colour is determined by the wavelengths of light that are absorbed or reflected by the object and we perceive the colour only when the reflected wavelengths reach our eye. This is referred to as an objects spectral reflectance because colour comes from light made up of different wavelengths or frequencies and the variations make different colors. For example, the green in leaves is because most common plants absorb red, orange, blue and violet but reflect all of the green wavelengths. The range of colors that are visible to the human eye can be found on the electromagnetic spectrum within the visible spectrum range. Ultraviolet and infrared are light frequencies which occur on the outside of the visible spectrum but most birds and insects, such as honey bees can see ultraviolet light and snakes can see infrared light. Infrared is electromagnetic radiation with a wavelength longer than that of visible light but shorter than radiation microwaves. The infrared camera picks up the wavelengths that indicate the comparative thermal variations between objects.

Thermal imaging is used by this Centre for capturing the thermal distribution of plants, either individually or over whole crops. It records the temperatures variations in real time, allowing the researchers to see and accurately measure heat production or dissipation process or other factors. They are looking for a comparison between cool and hot plants as cool plants are the ones that are stress resistant, healthy and transpiring. The process that keeps a plant cool is transpiration (a process similar to evaporation), where the plant loses water vapor via mainly the leaves, but also the stems, flowers and  roots. The surfaces of leaves are covered in tiny pores called stomata which are opened and closed by a border of ‘guard cells’ that operate the function of photosynthesis. This is the process that converts carbon dioxide and water, using the energy from sunlight, and releases oxygen as a waste product. If a plant is too wet, dry, sunbaked, cold or in saline water the camera will pick up its stress.

my first leaf in the closed FluorCam.

My next lesson of the day is with the second Technical Officer Scott Kwasny (two Scotts, I resist making jokes about cloning…) who introduces me to the closed and open sytem FluorCams which image the multispectral kinetic fluorescence of plants. To start with we go out into the sunlight and pick a few leaves from the garden to take back inside. We look at the closed FluorCam first, a box which consists mainly of a CCD (charged coupled device) camera, and fixed LED panels. The pulsing red LEDs provide a uniform irradiance capturing the photosynthesis on the sample leaves as pinpoints of light. It is quite beautiful to watch in real-time on screen as it sparkles and fluctuates, but as a data based system, the FluorCam software isn’t set up to capture high resolution images, so I can only gather screen shots. Again, this technology allows them to assess stress resistance in plants. The open system allows for larger sections of plants to be examined, and then they also have a fluorCam controlled by a robotic arm that can take a series of images over several potted plants.

Looking toward the future with the Phenomobile, The CSIRO, High Resolution Plant Phemomics Centre.

Later in the week I am taken out the CSIRO’s Ginenderra Experiment Farm with Carl and Mikala from the CSIRO’s communication team, to see the HRPPC team launch their new instruments, the tethered blimp and the ‘Phenomobile’.  Just on outskirts of urban Canberra, we suddenly turn off the bitumen and make our way down a red dirt road through paddocks of very plush sheep toward a small gathering of cars and odd shaped trailers in the middle of a wheat field. The Phenomobile is ready to go, custom designed to incorporate a golf buggy raised up stilts, it zooms along at about 7km per hour. Mikala tells me she’s trying to get the story into the Top Gear magazine. It’s a cool looking contraption and it’s the first time its been taken out for a spin over the crops. With David at the wheel, they check first to see if it passes the first criteria which is not to crush the plants; designed to straddle a plot, the wheels going either side down the ruts. As it travels it collects measurements, simultaneously gathering data for canopy temperature, canopy volume/biomass and ground cover. Designed to integrate a range of remote sensing technologies for phenomics field measurements at the plot scale, it also has a stereo-imaging rig for 3D reconstruction to image canopy volume, mean plant height and density.

Xavier wrestling the blimp from its trailer.

We then wait patiently for the next exciting moment when they release the blimp from its purpose built trailer. Six meters in length, Xavier backs it out carefully as there is a strong breeze. It bucks around and I watch while the team hold on tight as they fix the camera’s to its undercarriage. They have acquired the blimp as an aerial platform for imaging an entire field at one point in time. Able to carry up to 3kg it will hold both an infrared and a digital colour camera to operating in a height range of 30-80m above the field. The infra-red thermography and colour images will indentify the relative differences in canopy temperature indicating plant water use, an important trait to understand. As it rises higher the blimp scoots about in the sky, its rudders are controlled by a remote it sails into the wind. With the cameras swinging beneath it looks well endowed, overfed kite. Tugging at its tether way up in the sky, contrasting against a deep blue sky crisscrossed with vapor trails, I imagine the birds eye view of the world below.

Posted in project, research | 1 Comment

a natural digression…

I’ve been busy lately.  This week began by setting up an exhibition Natural Digression at Level 17 Artspace, in Melbourne. In the last few years I’ve become part of a group of seven like-minded artists which includes Penelope Cain, Waratah Lahy, Alison Munro, Kirsten Farrell, Ellis Hutch (aka Kate M Murphy) and Rose Montebello.

Waratah Lahy's series, Photographing a work of art, 1-6, Charcoal, pastel pencil and conte on craft paper 84 x 59 cm, with the amazing birds-eye view of Melbourne and the Yarra out the window.

We got together initially as a way of supporting each other’s ideas and encouraging each other to keep making, despite the usual setbacks; full time work, children, failed grant applications etc. Alison called us the Saddle Club and the name has stuck. We are all interested in similar things, and are influenced by literature, history, philosophy and science, but our practice is varied. Our work connects through a shared curiosity of how visual narratives are created to describe the moment of passing between fact and fiction. While we have studied in traditional mediums such as painting, sculpture and printmaking, our work is interdisciplinary; themes are worked on and variations of possibilities are teased out through a range of mediums; needlepoint, video, animation, paint, hot glue and collage constructions. The title of the exhibition plays on our collective fascination with observation, metaphor and transposition, but neatly rounds up how each of us digresses, taking the viewer on major detours and transformations before the truth of the matter can be established.

Natural Digression is our first exhibition and if you can, please visit! Its at Victoria University, 300 Flinders St, Melbourne until the 29 October 2010. It’s the first time we have seen our work together and it hangs really well. There is an excellent amount of variation to make the show interesting, and the works are range from being bold, colourful and delicate. One of Al’s works sold with in half an hour or putting it up.  If you’ve missed this exhibition our next one is in Sydney at UTS in March 2011. For this exhibition we are lucky to have curator and writer Yolande Norris on board.

Erica Seccombe, bioplastica, 2010. digital animation projection, 5.24 min duration.

I put some new X-ray rotations in the show. I’ve found that because Drishti has developed and I’ve got a bit better at using it I’ve enjoyed remaking some of my work from Nanoplastica. In this piece I showed at Level 17, Bioplastica, I’ve made only two rotations lurid green, and they slowly reveal the objects internal structure.

Waratah is fascinated by the changes in a person’s physical demeanour, gesture and posture that occurs when they are absorbed in the act of observation, particularly at that instant where a physical change is wrought through the mediated gaze of the camera; the body twisting and contorting to capture the perfect shot. Recording these fleeting images though the eye of her own lens she further explores these subjects though drawing and painting. By encapsulating the fluidity of these moments and retaining a photographic influence, she creates in her work a new and clearly altered space. Waratah holds a Doctor of Philosophy from the ANU School of Art, recently exhibiting at Brenda May Gallery, Sydney, and at the Canberra Museum and Gallery.

Kirsten Farrell, Pretty Ulysses 2008, acrylic on acrylic sheet, 1200 x1000 mm

Kirsten Farrell investigates the connection between painting and fiction in that they are both windows into other possible universes. Translating some of her favourite fiction into systems of colour to see how those universes might appear, the stories she has chosen vary from selected chapter titles and James Joyce’s Ulysses as they appear on her ipod; some Dr Seuss; some translated poetry by Sappho and spam email text. Kirsten Farrell is currently a PhD Candidate at the ANU school of Art, Canberra, recently exhibiting at Canberra Museum and Gallery and MOP Sydney.

Ellis Hutch studied Australian Sign Language (AUSLAN) with the purpose of understanding better the subtleties of gesture and how we communicate in the absence of a vocal language. Her video installations, (in the foreground in the top image) of hands signing the poetry of Emily Dickinson in AUSLAN, explore the intersections between sign and language, between codified sign systems and the unconscious physical gestures we all make; interpretation and meaning is abstracted in the silence. Ellis’ current art practice spans between Queanbeyan and Thailand; in between indulging her alter ego, Bullseye Betty, on the Roller Derby circuit.

Rose next to her work, Matched opponents, 2010 paper collage, 400 mm diameterRose Montebello makes these really intricately cut layers of collage. She is interested in representations of the natural environment,  in particular she perceives the animal kingdom as a place of sublime drama and monumental wonder, where the extremes of life are ever pressing in the form of procreation, survival and inevitably death. Using found images collected from a range of second hand nature books and children’s encyclopaedias from the 1960s, 70s and 80s, she chooses images that capture decisive moments in the lives of wild creatures in the natural world; a place of both simplicity and clarity and beyond the realms of contemporary everyday life. Through detailed cutting, reconstruction and application of paint to an image’s surface, she embellishes and recreates these moments of heightened intensity. Rose was recently artist in residence at Megalo Print Studio, exhibited at Canberra Contemporary Artspace and is an active member of BEAM.

Alison Munro, Small red-orange knit crystal, 2010, pigment markers on paper, 76 x 56 cm.

Al Munro uses textile and drawing-based media to examine processes of inscription and translation in relation to scientific representations of the natural world and how these might contain potential for new ways to ‘read’ nature. Her work takes as its starting point a number of visualisations developed contemporary and historical crystallographic texts. Through the use of a ‘drawn’ stitch as a visual analogy for these encoding processes – the individual stitch is a unit of code which can be repeated in an infinite number of ways to create new entities. Al is currently a PhD candidate at the ANU School of Art and recently exhibited at Craft ACT and Brenda May Gallery, Sydney.

(Image to come) Penelope Cain takes as a starting point Darwinian notions of evolution and its applications to human and animal behavioural science to reflect on the contemporary urban condition, positing a co-determinism between human social behaviour and the built urban architecture that surrounds us. She uses drawing, video and photography to tease out these hypotheses. Penny is based in Sydney and most recently exhibited at the Centre for Contemporary Photography, Fitzroy and in Experimenta Utopia Now, The Black Box, Melbourne. She has recently been awarded the Power Institute residency at the Cite International des Arts, Paris, for 2011.

A small section of the new taxidermy display at the Melbourne Museum

Only four of us, Penny, Kirsten, Rose and myself,  got to go to Melbourne to be at the opening, but it was a lot of fun. While we were in Melbourne Rose and I found some time to check out the Melbourne Museum and the highlight was the new taxidermy display.  The week then ended back in Canberra celebrating PRINT BIG, Megalo Studio + Gallery’s 30th Birthday bash at the Fitter’s workshop. Over 400 people turned up for the Friday night party, and then more than a thousand people visited over the weekend while the displays stayed up.  It was a BIG end to a big week.

After a big weekend, BIG PRINT at the Fitter's workshop, Kingston foreshore, ACT

Posted in excursion | Leave a comment

growing pains…

Paul Klee, Pathetisches Keimen (failed or pathetic germination) 1939, 281 (V 1), Coloured paste on primed paper on cardboard 25,5 x 48,5 cm Zentrum Paul Klee, Bern

In the next fifty years we must produce more food than we have consumed in the history of mankind.

Dr Megan Clark, Chief Executive and CSIRO Board member, 2009.

My project has taken a short but relevant diversion. While clumsily growing mung beans for 3D X-ray it occurred to me that I should visit some folk who know how really to grow things, and the CSIRO’s Plant Industry department was on my radar. Then suddenly (or serendipitously) just before October, I was granted access to the CSIRO’s plant industry facility as part of the Plants Under the Microscope Artist-in-Residence at the High Resolution Plant Phenomics Centre (HRPPC) on Black Mountain; just a short walk up the hill from Applied Mathematics. For two months I will get this amazing opportunity to look at how the Centre’s scientists are perceiving plant growth through new generation computer visualisation and robotic technologies. It has great resonances with my current project.

Only last month I was perusing the CSIRO website for a juicy quote to help with an essay I was writing about my project GROW and I came across an adapted transcript of a speech delivered by Dr Megan Clark, CSIRO’s Chief Executive at the Science and Technology in Society Forum, Japan, on 6 October 2009. In her talk Sustainable Agriculture: Feeding the World, Dr Clark discusses the global concerns for increased food-insecurity, urbanisation and carbon-contraints. Dr Clark described how these three forces combined will reshape the world as we know it. Warning that current crop yields will need to be doubled by 2050 to feed a global population, Clark predicted that to overcome the predominant challenges of reduced natural resources and threat of climate change, the forthcoming agricultural revolution will need to be directed by new technologies and genetic improvements. It would also appear that our desire for bio-fuels is also playing havoc with our need for basic sustenance and the preservation of the natural environment.

Inside the CSIRO's High Resolution Plant Phenomics Centre

Doubling our current global crop yields in just forty years is a tall order, we are talking several million tonnes annually, but this is where the High Resolution Plant Phenomics Centre comes into play. Opened only last September 2009 it is the grooviest facility, housed in a fabulous retro-fitted space-aged designed building with round edge porthole windows. It is like stepping into a 1960s television set from Get Smart.  Inside it is all smooth lines and glass. As a certified PC2 facility they have to follow guidelines about security so that GM and non-GM crops aren’t trailed in and out – so one waits for automatic doors to close while another one opens. Its all clean and uncluttered, a perfect artist’s studio! I like it so much I’m not sure if they are going to get rid of me that easily at the end of November. The challenge I have been set is to come up with a body of work in six weeks that reflects the Centre’s premise and technology for a small dispay area they have designed and are building in the entrance area.

The HRPPC focuses on ‘deep phenotyping’ which means thoroughly investigating and understanding a plant’s metabolism and physiological process within. They also set out to determine the plants mechanistic behaviour through ‘reverse phenomics’. A plant’s phenotype is any observable characteristic or traits it displays which is the combination of both its genetic expression and the influence of environmental factors. To work out how we grow crops in a changing environment the HRPPC. To work out how to grow crops in a changing environment the HRPPC, is developing and employing  advanced research tools to survey the function and performance of crop species under controlled conditions in the laboratories and out in the field. The HRPPC uses a combination of technologies and apply them through range of robotics, imaging and computing. It probes a whole range of conditions such as drought and salinity tolerance, heat and frost etc. The investigation  focuses on both individual plants and large scale ecosystems. For example they have commissioned a remote control blimp that can hover above while recording information across an entire field.

Dr Bob Furbank's presentation at the ANU

Just before I began my residency Dr Bob Furbank, Scientific Director of the HRPPC,  and Dr John La Salle, Head of the Australian National Insect Collection give a talk to the ANU Department of Applied Mathematics. Both came to explain the e-science and mathematical challenges that a faced in both their facilities. These challenges include bringing together data capture, image analysis, and bioinformatics tools with high throughput Plant Biology; robotics for image capture; high performance and computing (HPC) and maths for image analysis; terabyte storage repositories, ontology driven databases with fast searches. The resonances with Applied Maths is that both divisions are dealing with a balance between visualisation and data extraction through the application of 3D and 4D data. But it is important to recognise that the study of insects and plants differ as both areas are under pressure due changing environmental conditions for the development of rapid data acquisition technology specific to their needs.

As Dr La Salle explains, the insect world needs to be identified expediently as many are threatened with extinction.  Tiny creatures are integral part of any given ecosystem, but that if the ecosystem changes or is destroyed, then if we don’t already know what those important insects or bugs were, then we have little chance of understanding how to repair the damage. Dr Furbank explains that his unique set of challenges include being able to measure systems and discovering what traits need to be measured and how these models will relate to future crops. He explained that while there was a long history of scientific study of plants and that nearly every genome had been counted in all the known crop species, there was still a wide gap between current farming practices and emergent technologies.

Emily Kame Kngwarreye (Kam Kngwarray), Big Yam Dreaming 1995, synthetic, polymer paint on canvas, 291.1 x 801.8 cm, National Gallery of Victoria, Melbourne © Emily Kame Kngwarreye.

At the end of the talk everyone fell into an in-depth discussion about the development and application of new visualisation and data technologies and if and how such rapid acquisition of data will be possible, or not. It left me contemplating what kind of world there will be in forty years time. I will be 82 in 2050, perhaps I won’t even live that long. I wonder if future generations will loose their connection with the natural environment as predicted by scientists or as described in the collective narrative of science fiction. Will we avoid an environmental catastrophe? It seems as a society we aren’t prepared to make serious sacrifices to change our way of living but is it that we are unconvinced or just plain ignorant of the consequences. For example, it is a complex position to be if we disagree with the genetic modification of food. If we want to keep breeding and eating the way we do and feel PC about our fuels then will we have much choice but to grow GM crops? And what is wrong with genetically modified food when we’ve been cross-pollinating and growing our own favourite varieties for centuries? Do we prefer using litres of destructive pesticides when we can modify the gentic structure of plants to combat pests and disease while retaining the nutritional value?  And how am I going to make sense of all of this through a new body of work?

Posted in project, research | 2 Comments

n-people…

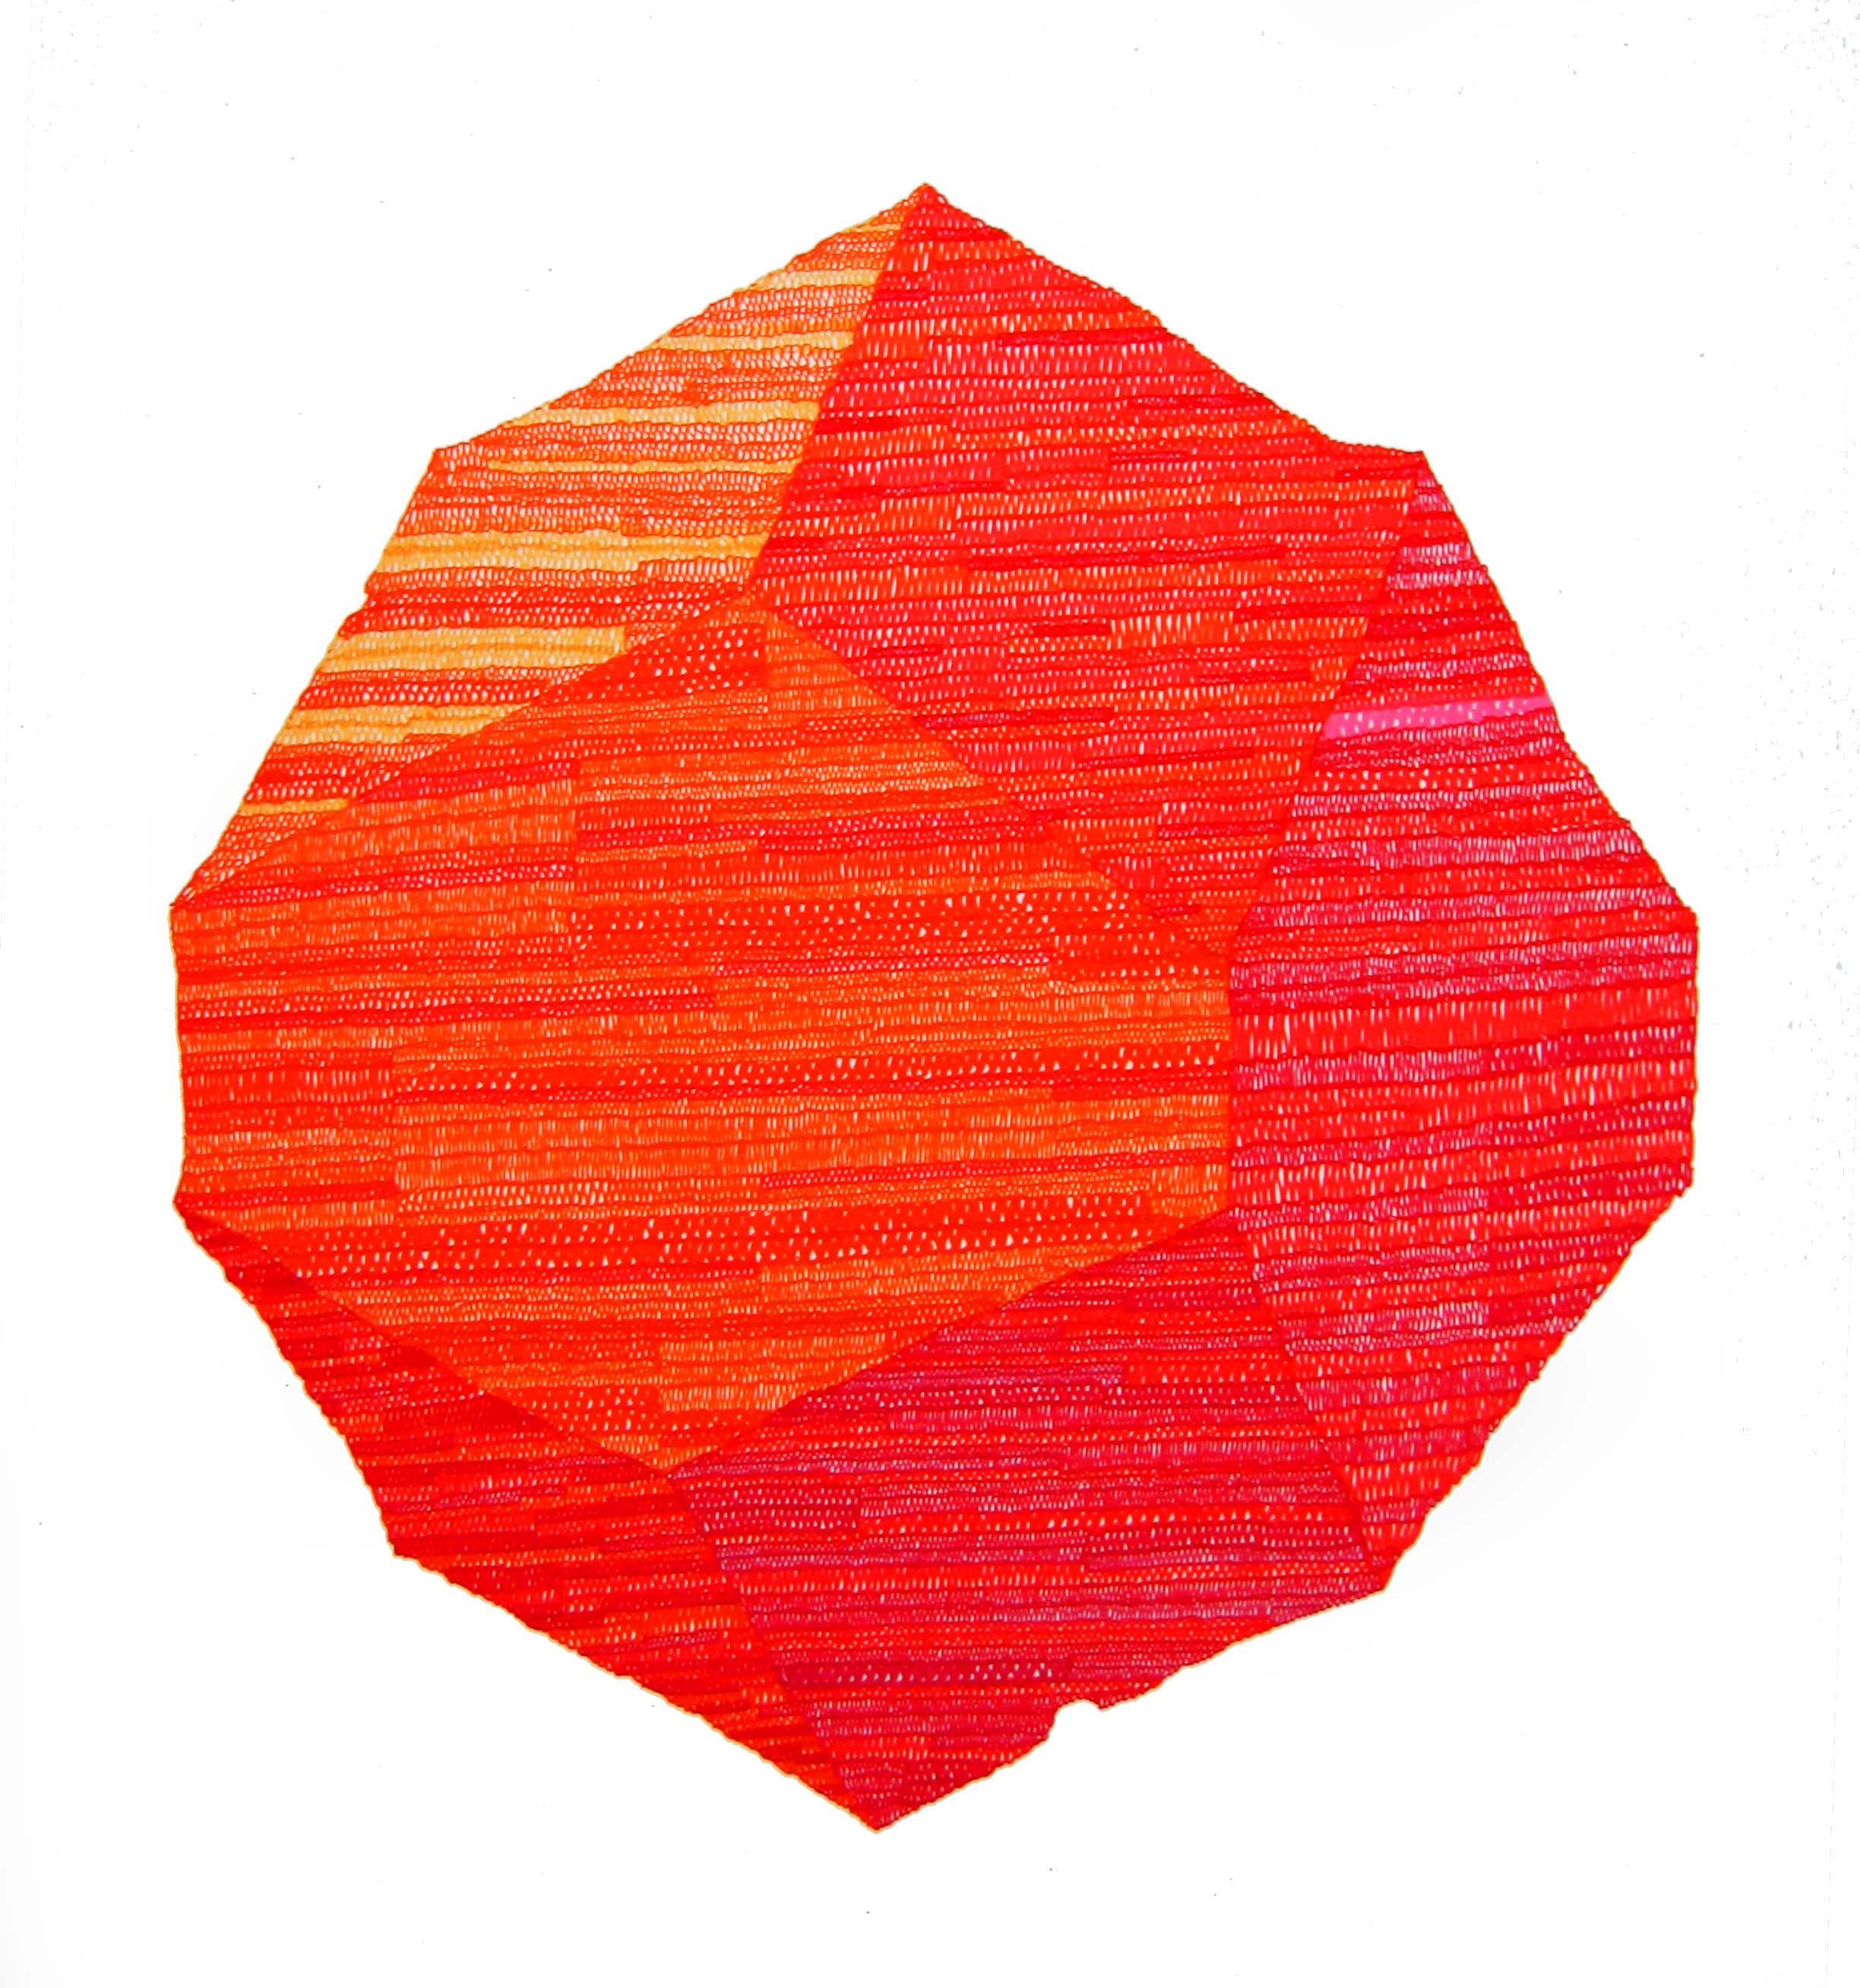
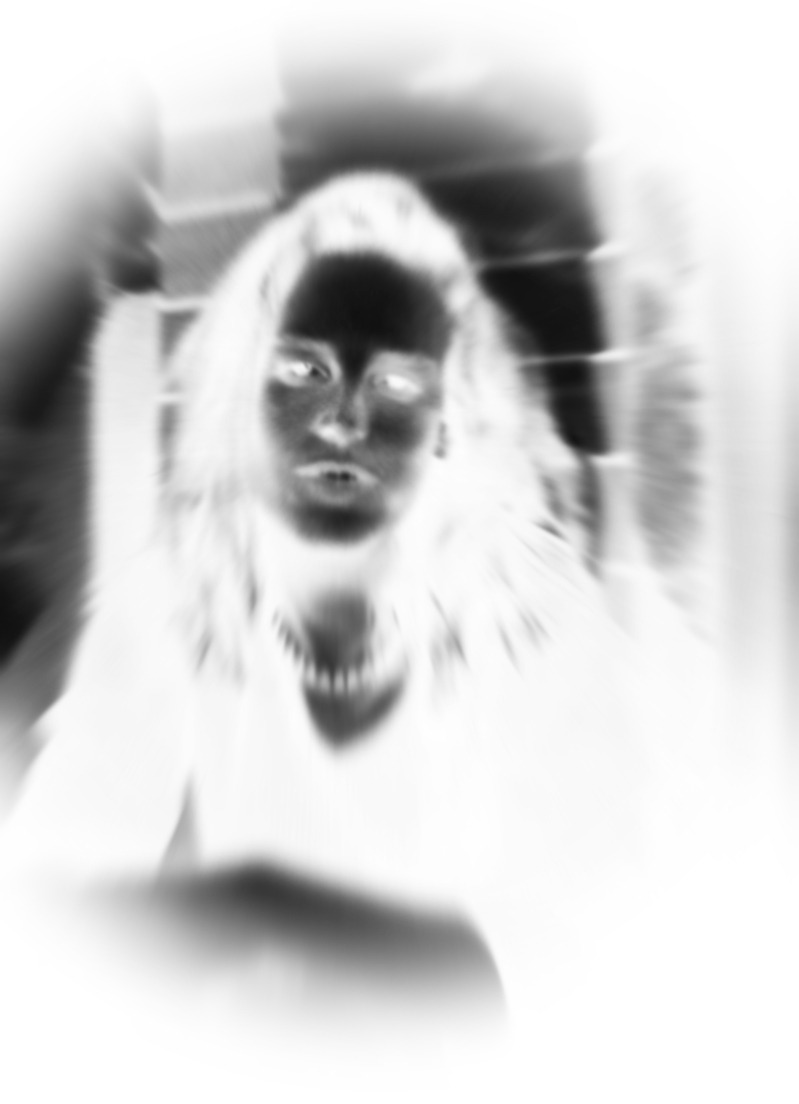
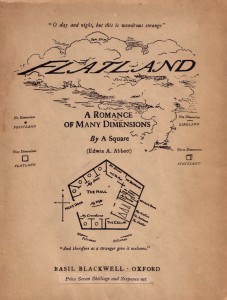
Edwin A.Abbot, Flatland: A Romance of Many Dimensions (cover detail)

AN UNSPEAKABLE HORROR seized me. There was a darkness; then a dizzy, sickening sensation of sight that was not like seeing; I saw a Line that was no Line; Space that was not Space: I was myself, and not myself. When I could find voice, I shrieked loud in agony, “Either this is madness or it is Hell.” “It is neither, calmly replied the voice of the Sphere, “it is Knowledge; it is Three Dimensions: open your eye once again and try to look steadily.”

Edwin A.Abbot, Flatland: A Romance of Many Dimensions [by a Square] Steely & Co, 1884, an exert from the chapter, How I came to Spaceland, and what I saw there…

Flatland, a satirical novella about the social mores of Victorian England, is considered the first creative work to reflect the mathematical theories of the fourth dimension and the departure from Euclidean geometries. It heralded the beginning of popular science and an era where ‘artists, writers and musicians believed they could express higher spatial dimensions’ [Henderson, 1983, p i] to reflect a dissatisfaction with materialism and positivism. Non-Euclidean geometry and the fourth dimension had a profound impact on modern art and literature in France, America, Italy, Holland and Russia in the late 19th and early 20th centuries.

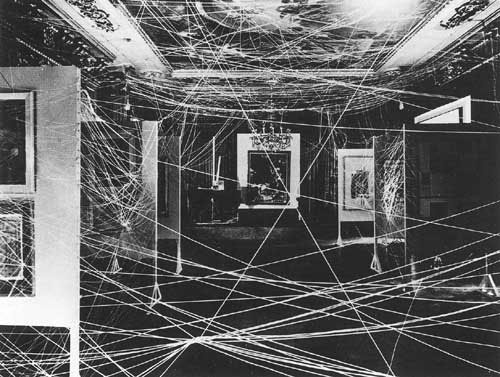
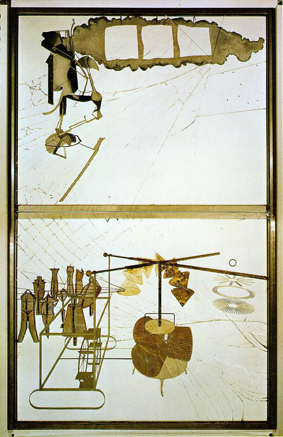
String Theory! Marcel Duchamp, Mile of String, 1942. Always ahead of his time.

The primary resource for this understanding is by Linda Dalrymple Henderson, Professor of Art History at the University of Texas, The Fourth Dimension and Non-Euclidean Geometry in Modern Art [Princeton University Press, 1983]. This book presents Henderson’s in depth study of the cultural consequences at the point of departure from Euclid’s postulate (c 300BC) to emergent theories of hyperbolic and elliptic geometries including the fourth dimension as the most important themes that unified modern art and theory for all time. Her work is a critical analysis of how the pioneering work of mathematicians such as János Bolyai (1802 -1860), Nikolai Lobachevsky (1792–1856), August Möbius (1790-1868) and Charles Howard Hinton (1853 – 1907), influenced the growing discourse which was to shape the modern world as we now know it. She focuses only on artists and writers who kept direct records, such as personal journal entries or public documents, which state their understanding and interest in these topics. In this way, Henderson proves the influence in society as new scientific and mathematical concepts were released and disseminated to the general public through published articles or lectures. As Henderson explains:

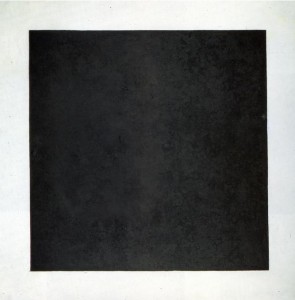
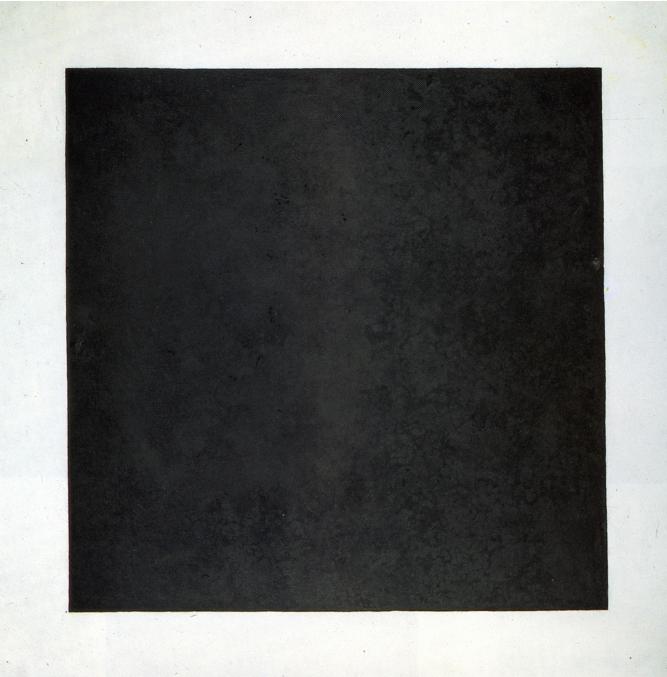
Kasimir Malevich’s Black square 1913. Malevich (1879 – 1935) pioneered abstract painting and Black Square is his signature work. This painting has been interpreted as a visual metaphor for both infinity and the void. For Maleivich the black square signified an endless space when leaving the world of three dimensions.

the complex spatial possibilities suggested by a fourth dimension, as well as by the curved space of non-Euclidean geometry, were the outgrowth of developments in early nineteenth-century geometry. … Like a Black Hole [of the late twentieth century] ‘the fourth dimension’ possessed mysterious qualities that could not be completely understood by scientists themselves.[Henderson 1983, p xxiii.]

Drawing on the fourth dimension and popular science of the time, literary figures such as P.D Oupensky, Alfred Jarry and Ramond Roussel re-imagined the world beyond the immediate sensory perception, creating potential futures for social organisation. This also captured the imagination of artists such as Marcel Duchamp, Kasimir Malevich, Max Weber, Frances Picabia and Laszlo Moholy-Nagy (to name only a few). By challenging the established laws of representation – of life or reality – in art, they contributed to the innovation of movements such as Cubism, Surrealism, Abstraction and Russian Suprematism.

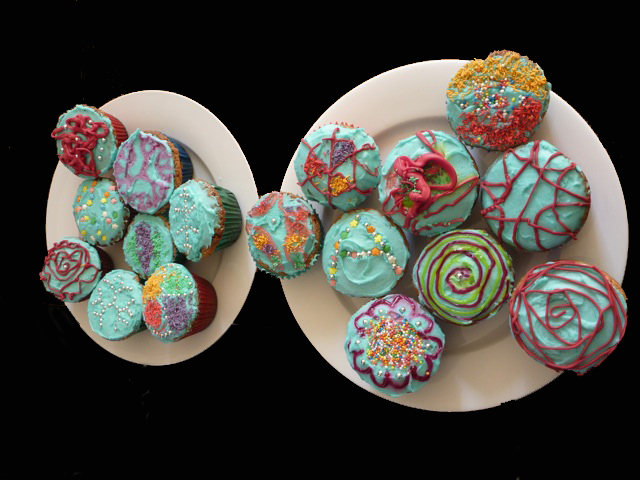
Theory in practice. Hyperbolic cupcakes, Stu Ramsden, Myf Evans, Photo Vanessa Robins

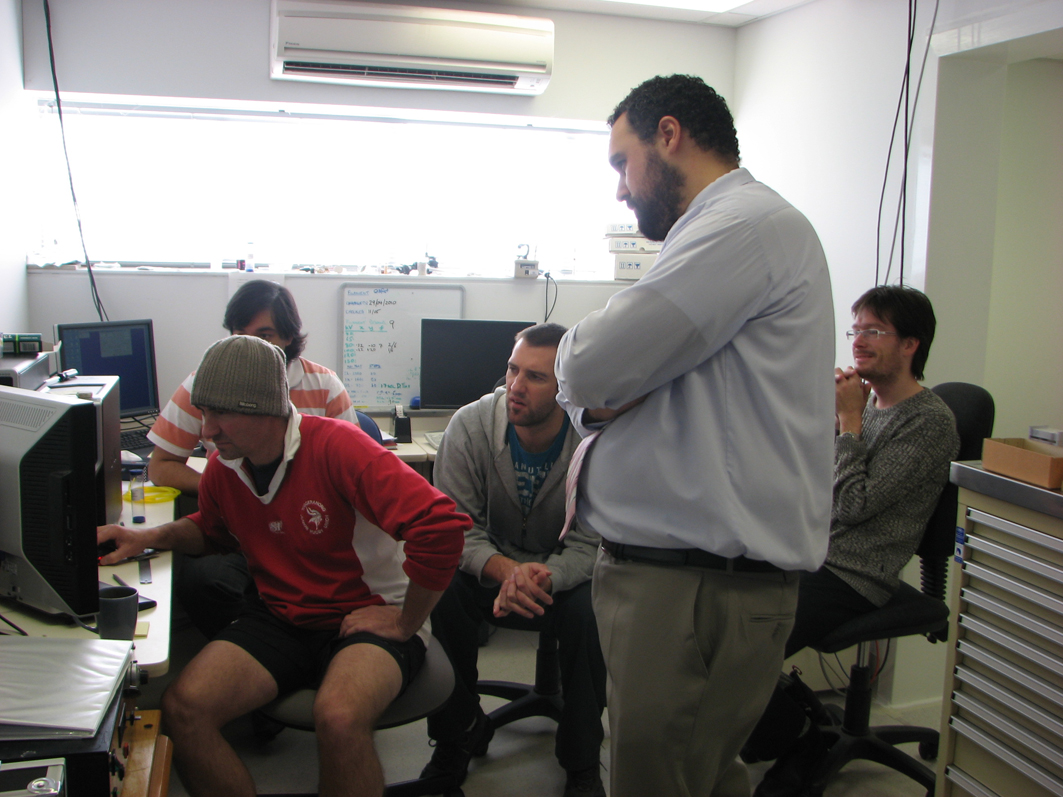
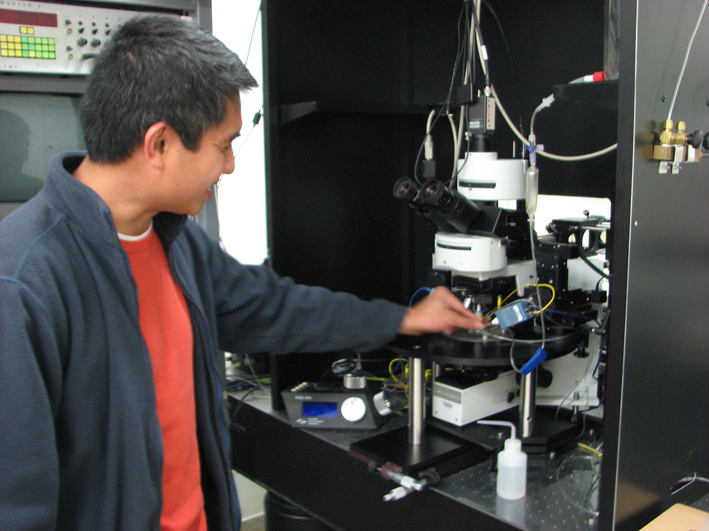
Contemporary Mathematics, Physics and the sciences continue to inspire society, art and culture and it has certainly been an experience getting to know the people in the ANU Department of Applied Mathematics. Its fun making connections between history, art, science and new technologies and learning how mathematics is applied to physical material on a molecular scale. Within the Department, there is a group investigating complex structures and hyperbolic networks lead by Professor Stephen Hyde which includes Dr Vanessa Robins, Myf Evans, Stuart Ramsden and there are many others who come and go such as, Anna Carnerup and Toen Castle, depending on the research projects and available funding. These researchers are great communicators with a great ability to visualise their work through 3D modeling and connect with other visual resources or artists who incorporate geometries or patterns in their work. To find out more about their research I strongly suggest you follow the links and enjoy where it takes you. Unlike the turn of the 20th Century, there is now a plethora of online information and visual aides for mathematical concepts.

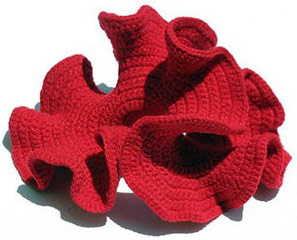
Getting crafty, an more classic example of hyperbolic crochet

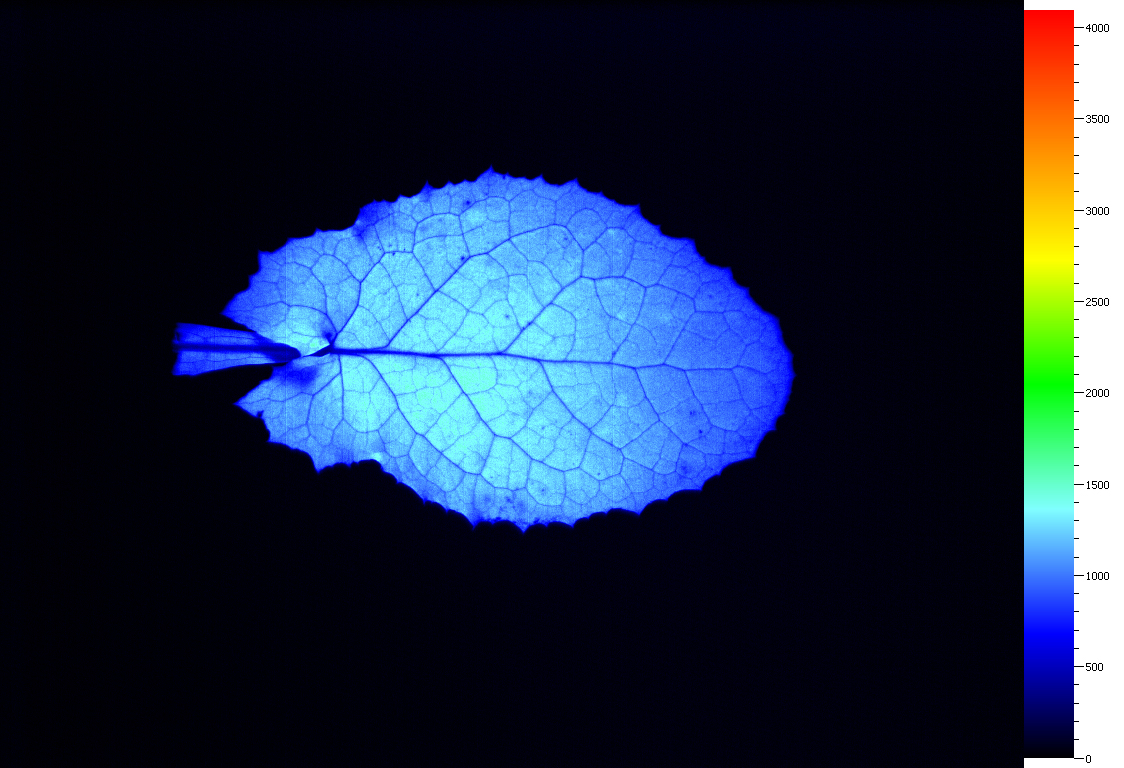
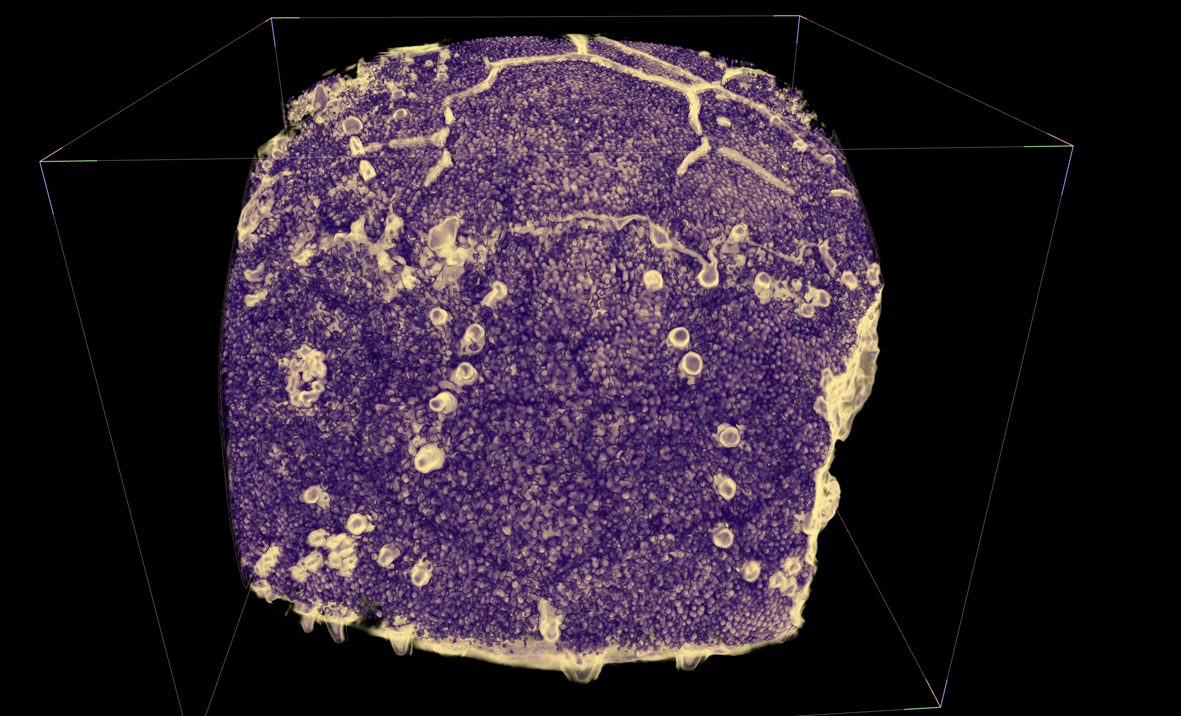
Vanessa is the person who introduced me to the concept of hyperbolic knitting when I met her in 2006, with her own sample in red wool. In 1997 Cornell University mathematician Dr Daina Taimina worked out how to make a physical model of hyperbolic space that allows us to tactilely explore the properties of this unique geometry through the process of crochet. This has since developed into the Hyperbolic Coral Reef project by sisters Christine and Margaret Wertheim. I’ve found that I no longer look at kale leaves in quite the same way. Myf has now convinced me that beauty products really are a waste of time, through her investigation on visualising the complex molecular networks that makes up the sub-cellular structure of skin. I have also grown a new appreciation of the work of Maurits Cornelis Escher (1898 –1972). My understanding of Esher’s work was more along the lines of repeat patterns and Möbius inspired architecture, I hadn’t understood the significance of his Circle Limit series as mathematical models for hyperbolic tessellations.

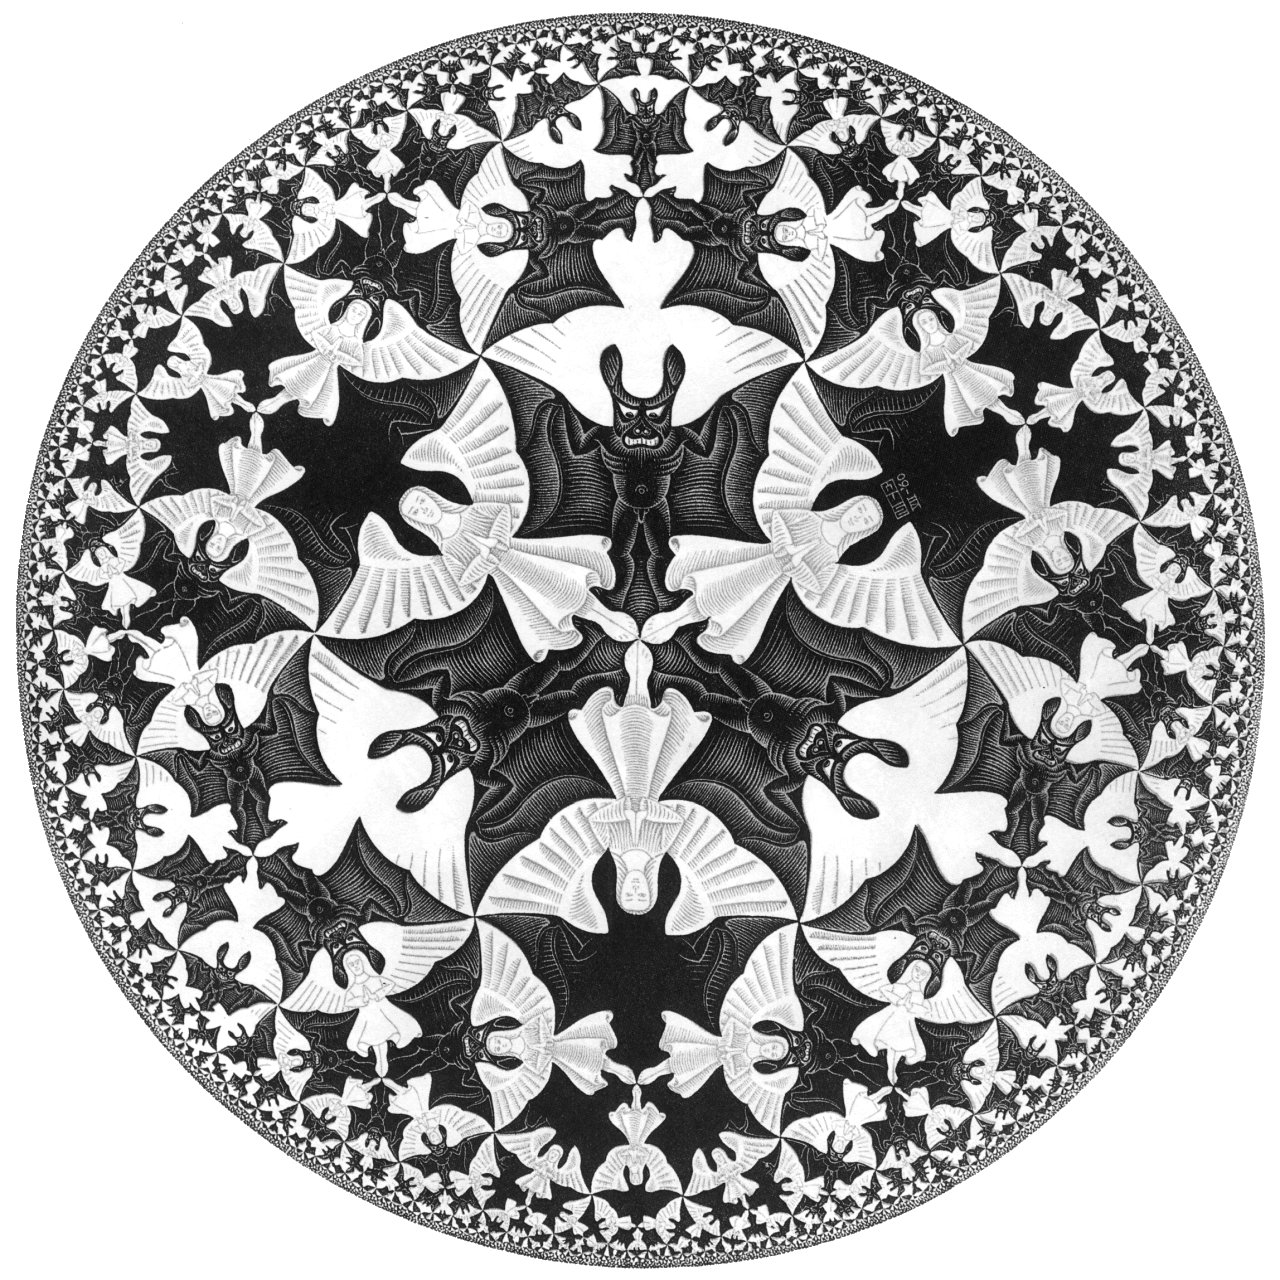
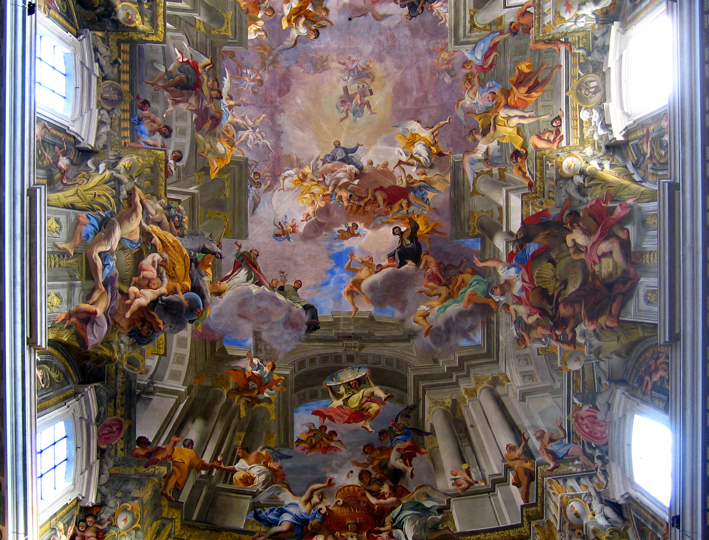
M C Escher, Circle Limit 1V, (Heaven and Hell), 1960, Woodcut, 420 x 420 mm

Here also we have the components diminishing in size as they move outwards. The six largest (three white angels and three black devils) are arranged about the centre and radiate from it. The disc is divided into six sections in which, turn and turn about, the angels on a black background and then the devils on a white one, gain the upper hand. in this way, heaven and hell change place six times. In the intermediate, “earthly” stages, they are equivalent. [In the words of M C Escher, in The Graphic Work of M C Escher by M C Escher, Ballantine 1975.]

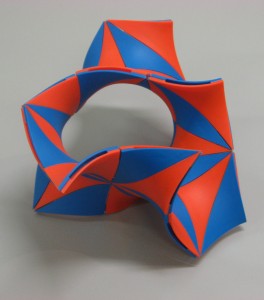
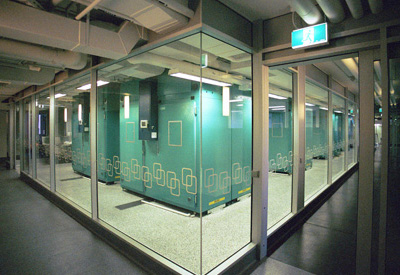
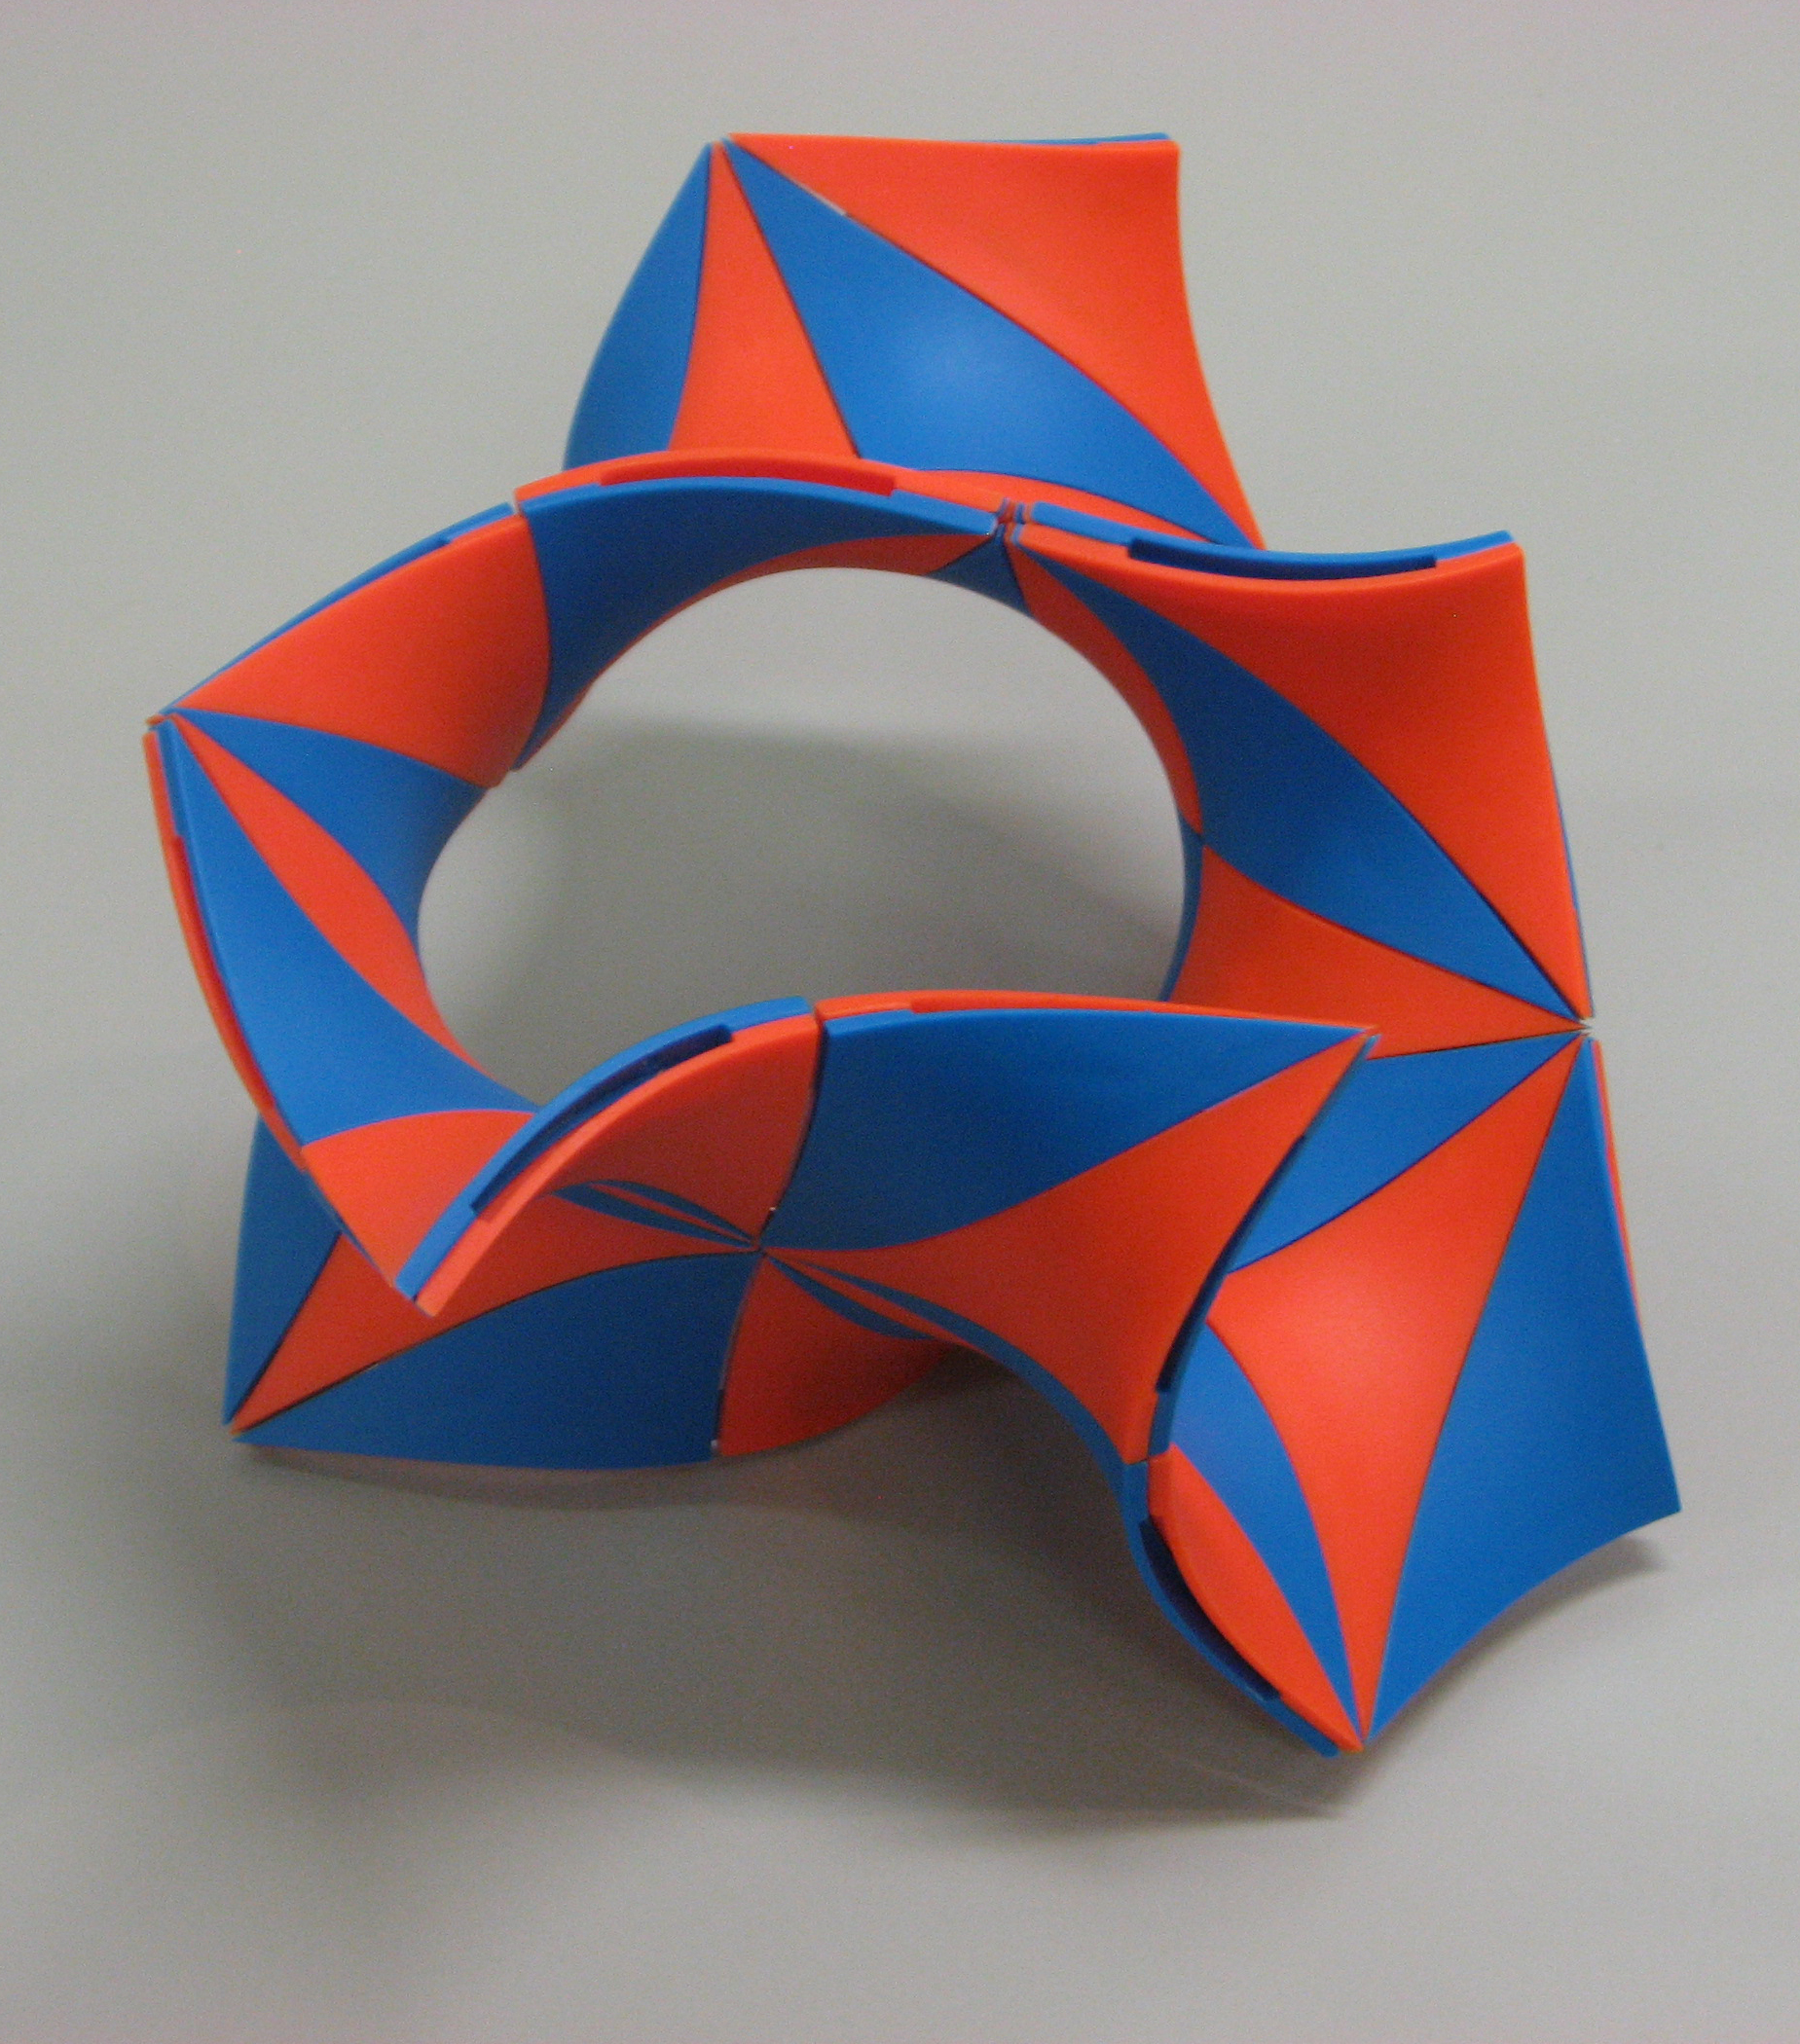
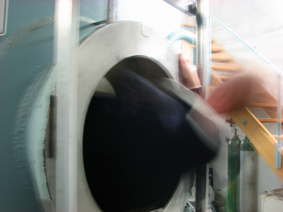
The Gyroid prototype, an example of hyperbolic surfaces and tessellation as a puzzle. Copyright Australian National University.

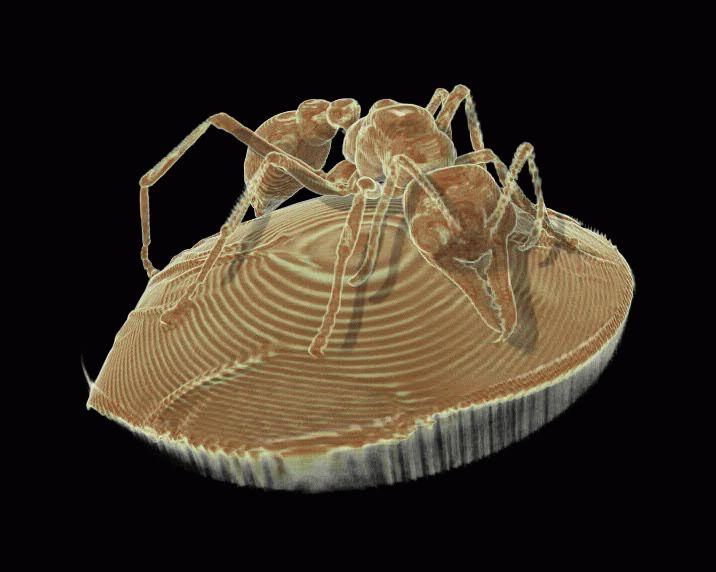
Stu has been busy in collaboration with Tim Senden, Vince Craig and Gerd Schroeder-Turk, working on a soon to be commerical puzzle named the Gyroid, where individual pieces fit together to make a range of 3D forms based on hyperbolic structures, as one might find in termite tunnels. I’ve watched them go from early prototypes to the first full set of pieces in moulded plastic. Stu has been piecing them together to work out a full range of forms. There are two types of puzzle pieces, barely indistinguishable to a novice, but it is impressive watching Vince, Stu, Myf and Vanessa build the structures in seconds. It took me a couple of minutes to put four together in my first take, but I’m a little bit spatially challenged.  This puzzle is its preliminary stages and will eventually be produced for a commercial market. I have kindly been given permission to reproduce an image of the Gyroid for this blog. It is very cool and a lot of fun.

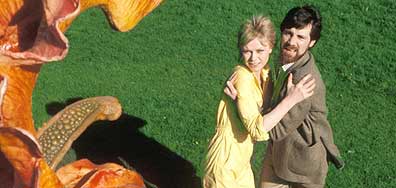
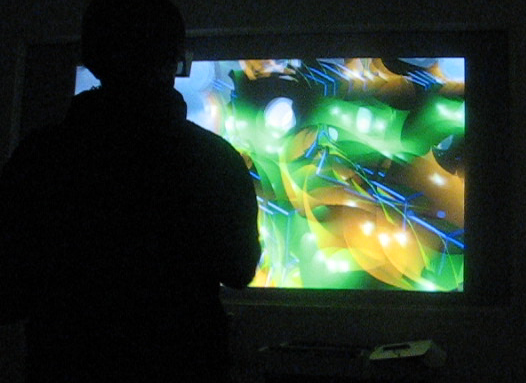
Earlier this year, Stephen, Myf, Stu and I went on a field trip to Sydney to catch the Olafur Eliasson’s exhibition Take your time at the MCA. Many of his works in this exhibition explore geometric form and refer complex networks in natural and artificially occurring systems. The world around us is full of relationships, rhythms, correlations and patterns, and mathematics underlies all of these, and can be used to predict future outcomes. Eliasson’s work is also driven by the experience and sensation of an event, all of which can be infinitely variable depending on the individual and how the moment unfolds. I enjoyed Take your time because my experience of the exhibition was mediated by the company I was in, which is exactly how Elliason views his work as having a fifth dimension, if you consider the fourth being time, and that this fifth, …

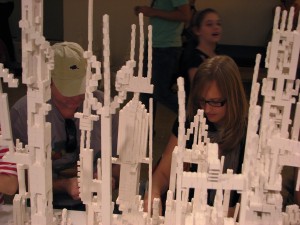
Myf and Stu participating in Olafur Eliasson’s ‘The structural evolution project’ (2004) at the MCA 2010

might also be called the dimension of engagement, because it allows for a greater relativity in our understanding of the other three or four dimensions. To emphasize the importance of engagement, I have tried to connect it with temporality by introducing the idea of Your Engagement Sequence, or YES. Any situation or object can be made relative and negotiable if you insist that YES is a necessary component of the perceptual process. We could say that YES destabilizes truth, turning it into an individual experience.

[Eliasson, Olafur and Robert Irwin. “Take Your Time: A Conversation.” In Take your time: Olafur Eliasson. Edited by Madeleine Grynsztejn. Exhibition catalogue. San Francisco: San Francisco Museum of Modern Art; London: Thames & Hudson, 2007: 51-61.]

Posted in excursion, research | 2 Comments

inside out…

Leopold & Rudolf Blaschka, Doliolum Mulleri, National Museum and Gallery, Cardiff. Glass c1890, Of the genus of the Doliolidae, a free-swimming tunicate with a barrel-shaped transparent body. http:designmuseum.org/design/leopold-rudolf-blaschka

I began using the Department’s Drishti software in 2006. As I learnt to control a 3D object in a virtual space I experienced a similar feeling to blowing or turning hot glass on a punty; I could see the object but couldn’t touch it. Playing with my first dataset of a miniature plastic octopus, and exploring the variations of transparency and opacity, reminded me of the exquisite glass models of sea animals that were produced by Dresdon artisanal glass makers Leopold Blaschka (1822 – 1895) and his son Rudolf (1857-1929). In their lifetime the Blaschka’s supplied natural history museums across the world with thousands of realistic botanical and marine specimens. Their work was inspired by the rapidly expanding business of exploration and collection of rare and exotic species from both land and sea. The Blashka’s pieces are meticulously detailed and anatomically precise, and through the medium of glass they were also able to capture the translucence of creatures such as a live jelly fish. At the time natural history museums such as the Harvard Botanical Museum and the National Museum of Wales in Cardiff, commissioned the Blaschka’s to create models because they preferred these replica’s to the endless displays of grey lifeless specimens in jars.

plastic octopus in Drishti, my first view 2006. Erica Seccombe, Vizlab, ANU Department of Applied Maths

It was not such a giant leap to make this connection as Drishti is very much in the same business as the Blaschka’s were. Drishti is a unique purpose designed volume exploration software so named by its creator Dr Ajay Lamaye, meaning ‘insight’ or ‘vision’ in Sanskrit. This open-source software is continually rewritten and upgraded with new features and was developed specifically for the end-use of visualising tomography or electron-microscopy data, for both exploration and presentation. Its premise in visualisation datasets acknowledges that the information is equally important as conveying understanding to a research community or a lay-person. Importing raw datasets into Drishti enables the user to identify the essential material by trimming a clean sub-volume for rendering. The program’s transfer functions distinguish between the material density of surface and sub-layer data through the process of elimination or enhancement, for example; separating nerves, veins, tissue and bone. There is a wide range of choice through colour, rotation, cropping, clipping, positioning and fly-throughs, with the additional function of a key frame editor to capture still images and create animations of any length.

Ant volume imaged in Drishti, Dr Ajay Lamaye, ANU Vizlab,

Since its inception in 2004, Drishti has improved considerably in terms of its user interface, but as a user I have discovered that visualising true volumetric data is an acquired skill. The ability to image a dataset is not a straightforward procedure if you are unfamiliar interpreting volumes though histograms or navigating around a virtual 3D environment. But the point of end use is that you don’t have to be specialised in visualisation or skill, in the way that Leopold and Rudolf were dedicated to creating and constructing intricate models out of glass. But as a non-scientist and non-computer programmer I have been on a steep learning curve ever since I started my project. As I have mentioned before in previous postings, there is a great advantage of working in Vizlab and having Ajay just down the hallway. Many a time I have knocked on his door and he always has time for me, no matter how trivial the problem. If I didn’t have Ajay there to demonstrate functions or sort out glitches I would be lost. I do pride myself in being an independent user of software programs so when I’m using Drishti I always refer to the user’s manual on line. But I know when to call on Ajay.

Ancient Gogonasus advances evolution, Museum Victoria. The assembled complete skull of a gogonasus, whitened with ammonium chloride. Image: John Long, Museum Victoria

In 2006 there weren’t other people around actively using the program but as the 3D technology is now in demand, I am beginning to see how researchers are utilising visualisation tools for specific projects. I feel it is important for me to look at how data is treated through research as it take me out of the artist vacuum and in turn informs my work. For example here is a big difference between my datasets and 3D scans of fossils which are a billion times more detailed than a plastic miniature object or a mung bean. It is the scanning of fossils at the XCT facility and their visualisation in Drishti which has been one of the most interesting events. My basic undertanding of a fossil was that it was an imprint of the former being preserved for all time, and that the most solid examples of fossils are bones. What I didn’t realise was that fossils are often complete preservations, inside and out.  Now that 3D microcomputed tomography is available these fossil specimens are now challenging the established understanding of evolution.

Gogonasus imaged in Drishti. Associate Professor Tim Senden and Dr John Long (Museum Victoria) By the time fish crawled up on land most of the big evolutionary steps towards humans had been made - some 350 million years ago and a good 100 million years before dinosaurs. ‘Gogonasus’ is one of the pivotal fish in this evolutionary picture. Discovered in the Kimberleys in June 2005 the complete, articulated and three dimensionally preserved skeleton gives us a remarkably detailed insight into how forelimbs and air breathing developed. It challenges the view that a single species made the transition to land and shifts the focus to Gondwanaland as another source of the necessary biodiversity to support tetrapod (all animals with four limbs) development. Three dimensional X-ray microscopy (X-ray CT) is also helping to probe the way the sensory system was arranged and the complete set of facio-cranal nerves have been mapped with this technique, and completely mirrors that in human skull. Indeed the pectoral fin is comprised of the same set of bones we have in our arms. The discovery of this specimen is significant in that builds a greater understanding of why some fish have remained fish and others started to sniff air.

Fossil hunting is a big business and the monumental finds have always rocked the establishment. I’ve always like the story of Mary Anning (1799-1847), her famous find as a child in Lyme Regis is now fictionalised in Curiosity by the novelist Joan Thomas. Still the most exciting event for a paleontologist is to discover a fossil in 3D entirety. Fossil preparation is a whole industry of its own and there are many slow and painstaking processes one might go through to extract a fossil from rock; such as acetic acid baths, penetrative plastic or resin coatings. Traditionally, to see the inside of a fossil it would have to be physically sliced up. If the fossil is destroyed in the process of examination there is no going back, particularly if it is a rare find. Prior to X-ray CT there was no easy way that such detailed structural information could have been extracted from a fossil. Through X-ray, the fossil can be scanned inside a lump of rock, the rock dissolved virtually though transfer functions in Drishti. Even if the original fossil is destroyed or lost the full detailed dataset remains as an electronic resource that can be turned, cropped and examined repeatedly.

Through the XCT facility there is a very specialised group of Paleontologists lead by Professor Ken Campbell (ANU), Dr Gavin Young (ANU), DR Kate Trinajstic  (CUSTIN UNI), Dr John Long (LA County Museum) and Dr Richard Barwick (ANU) working with Tim SENDEN on scanning fossils of the Devonian lung fish. The term Devonian describes a geological period that existed over 400 million years ago and examples of life systems from this time show creatures adapted to various environments and climate, for example, fish evolving legs to crawl on land. These paleontologist are interested in these early vertebrates as our earliest known ancestors, and they have been mapping and comparing physical features to establish evolutionary theories. Micro-CT is providing an even greater level of clarity by revealing finer details of sensory systems inside the fine cranial and spine cavities, throut, snout, ears and jaws, soft tissue and even neurons, informing new research on the evolution of vertebrates. It is amazing to behold these scans in 3D. To the untrained eye they could be any bit of bone but Tim has pointed out to me the sections of fossil that are important.

The Queensland Lung Fish is one of three species of lungfish in the world and has a single lung-sac and breaths using a buccal force-pump similar to that of amphibians. It can grow up to 1.5 metres in length, weigh up to 40kg.

Dr Gavin Young warned me that if I am to mention placoderms I must not confuse the terminology with Pachyderm, a common trap for the unversed. Placoderms are considered the most diverse groups of the early jawed fishes. There are a recorded number of around two-hundred varieties of placoderms which evolved mainly during the Devonian period which diversify considerably but many becaming extinct at the end of that period. The ones that survived went on to develop into the first vertebrate giants. But I have learnt that the Queensland lungfish, Neoceratodus forsteri, is one of only THREE existing lungfish species left in the world and belongs to an ancient family of fleshy-finned fishes and is one of the oldest living vertebrates on the planet. Fossil records date this species back around 410 million years at the time other vertebrates were beginning to evolve and this species is often referred to as a ‘living fossil’ as contemporary specimens have remained unchanged over the last 100 million years.

John Long (left) and Tim Senden who found the specimen at Gogo 11 July 2005. Image Michael Nossal, Source Museum of Victoria

During the Devonian period the Australian landscape was vastly different to how we find it today. Apparently Canberra region was tropical covered in a shallow sea filled with coral reefs populated by lungfish. Wee Japser just west of Canberra is now a palaeontologists heaven for this period. Other sites range around the Kimberlies in WA in particular the Gogo formation inland off the coast, also a former reef, which is the only Devonian site in the world where you can find whole perfect, uncrushed fossils of fish. But don’t think you can just trip out there and find a few, its requires a lot of hard work and expertise; you would need to know what you are looking for. In 2005 Tim famously discovered the first complete fossil of well preserved Gogonasus. On his first field trip in the Gogo region with Dr John Long and his colleagues from the Melbourne Museum, he found one half of this fossil. When they realised how important this fossil actually was they returned to the exact spot according the GPS reading and Tim found the other half. This collaboration between Senden, Long and Trinajstic lead to another remarkable find of the oldest living evidence of live birth in a placoderm. By highlighting the umbilical cord and the baby fish in Drishti can the untrained eye understand what they are talking about. See the movie here. Naming this species Materpiscis attenboroughi after Sir David Attenborough, Senden, Long and Trinajstic launched their find at the Royal Institute Australia with a satellite hook up with Queen Elizabeth II !!

Quick links to these events, subjects, people & references can be found at:

RAPID ROUND UP: Worlds oldest Mother – live birth in the Devonian – experts respond

Gogonasus

Ancient Gogonasus advances evolution, Museum Victoria.

Gogonasus: PZ Meyers

Catalyst: ABC TV blog by Ruben Meerman

Materials Monthly: April 2006 David Salt

Posted in research | 2 Comments

trip the light…


Professor Röntgen at work "in the midst of an experiment on the new light". Walter. E. Hodgson in 1896 for The Windsor Magazine.

I didn’t think, I experimented

The words of Wilhelm Conrad Röntgen (1845-1923) whose discovery of radioactive waves and the process of x-ray revolutionised our understanding of the physical world. Where matter was previously solid, X-ray challenged the surface or appearance of things. In 1895 Röntgen was studying the phenomena accompanying various types of vacuum tubes when an electric current passes through a gas of extremely low pressure. He was investigating the properties of cathode rays, a field of research established by the scientists Plucker (1801-1868), Hittorf (1824-1914), Varley (1828-1883), Goldstein (1850-1931), Crookes (1832-1919), Hertz (1857-1894) and Lenard (1862-1947). ‘Cathode’ was the name Goldstein gave to the electric current generated in a rarefied gas environment by high-tension electricity from Heinrich Ruhmkorff’s induction coil, which was the first type of electrical transformer.  The critical conceptual path for the cathode tube also leading to modern optical technologies such as television.

Early X-Ray tube (attributed England ) approx 50 cm with a simple tiny rod cathode and a heavy metal anode. the blue glass seals and platinum connections indicate a production date 1900 or earlier, source:http://members.chello.nl/~h.dijkstra19/page5.html

Röntgen’s investigation led him to discovering a new kind of ray when he encased a cathode tube in cardboard and aluminium to protect it from a strong electrostatic field. While the light inside was contained he noticed a green fluorescent glow emitting from around the casing. From there Röntgen developed his experimental findings further. As the story is now told; working in his darkroom on the evening of November 8, 1895, he sealed a more robust glass tube in thicker black carton. Placing a paper plate covered on one side with barium platinocyanide in the path of the rays, he found that it became fluorescent as far as two metres away from the discharge tube. Subsequently during following experiments he realised that by immobilizing objects of varying densities and interposing them in the path of the rays against a photographic plate, would result in a recorded image revealing a transparent interior. The now famous image of his wife’s hand, complete with wedding ring, is considered the first “röntgenogram” ever recorded. The X in X-ray was Röntgen’s symbol for the yet unknown quality of the ray, and I guess the name just caught on. He won the Nobel Prize in 1901. Later on the physicist Max von Laue (1879-1960) worked out that X-rays have the same electromagnetic properties of light but have a higher frequency wavelength, for which he was awarded the Nobel Prize in Physics 1914 for his discovery of the diffraction of X-rays by crystals.

image of Kenyon Military Academy X-raying a hand. c1905 http://physics.kenyon.edu/

It is hard today to comprehend the excitement that such a discovery would have caused when images of these X-rays were first published in the early 1900s. For many X-rays were the first scientific proof of the fourth dimension as ‘glimpses into the invisible’. (Linda Dalrymple Henderson, The Fourth Dimension and Non-Euclidean Geometry in Modern Art, PUP 1983, pg 285) It initiated forms of occultism, its members believing that X-ray might also prove there is a soul. Forms of spirituality, telepathy and clairvoyant vision were popular among many avant-garde artists. Curator Corey Keller explains that not long after the first X-rays images were publicised, do-it-youself X-ray kits became commercially available to anyone who wanted to take up this new form of photography. Because of their relative thinness, human hands became an easily acquired image and it became popular for the rich and famous to immortalise their skeleton fingers and wrists draped in jewelry. [in the exhibition, BROUGHT TO LIGHT Photography and the Invisible, 1840-1900, San Francisco Museum of Modern Art, 11 October  2008 –  4 January 2009]

The hand of the wife of Nicholas II, the last czar of Russia, BROUGHT TO LIGHT Photography and the Invisible, 1840-1900, San Francisco Museum of Modern Art, 11 October 2008 - 4 January 2009

Enthusiasm for X-ray photography most probably waned when the harmful effects of radiation exposure was finally established, but in the beginning photographers who had access to this new form of light, trained it on just about anything just to see what it looked like. This is still very much the philosophy of contemporary X-ray artist Nick Veasey who has his own large format X-ray studio, who believes that;

We all make assumptions based on the external visual aspects of what surrounds us and we are attracted to people and forms that are aesthetically pleasing. I like to challenge this automatic way that we react to just physical appearance by highlighting the, often surprising, inner beauty.’ Nick Veasey www.nickveasey.com.

Visit his website to view the wide range of static subjects that Veasey has X-rayed, from flowers to airplane complete with hangar. There is a lecture he gave on TED where he describes how he photomontages the bigger pieces together. Veasy is also concerned about the digital age and image consumption, particularly in the age of security surveillance technology.  Believing that his work is a process of counteracting a loss of individual freedom he seeks solace in classic images natural beauty and general curiosity. I agree with Veasey in some respects, but I am inclined to think that there is something startlingly confronting and alluring about candid X-ray photography that takes this technology further than the static, traditional still life X-ray may reveal.

Human Cargo. This X-ray photo was taken in March 1999 by Mexican authorities who use X-ray technology to uncover illegal arms and narcotics. Mexico also faces the problems associated with human trafficking.

I remember the first reaction I had to newspaper image of a truck full of human cargo at a boarder check-point. Exposing more than just an interior, this image symbolises the desperate hopes of people who were either risking their lives for a better future, or who had found themselves trapped in a nightmare beyond their own control. Consider now that X-rays are installed in some airports; there is an argument that we will have no control over the dissemination of these images that reveal our private unclothed bodies, but perhaps collected over time these images will also capture some deeper insights into the contradictions of human nature; or maybe not.

But these images are not to be confused with the kind of morbid curiosity that draws us into other types of X-ray image; like the allure of a side-show exhibits. I’m sure I remember in the 1990s a daring X-ray of two men locked in anal sex, the image posted on a massive billboard on Oxford street (I may have made this up!).  I also once met a sword swallower, and these people I knew who were medical students X-rayed him swallowing his sword deep into his gullet, his multiple piercing highlighted along his tongue and nipples.  In fact I’ve found a site of similar sword swallowing images complete with X-ray movie. And then there are the peculiar X-rays of rectal foreign bodies such as vibrators, oranges wrapped in nighties, torches and drink bottles…well, you can search the web yourself if you want to pursue these kind of images.

chamaeleon, c1900 BROUGHT TO LIGHT Photography and the Invisible, 1840-1900, San Francisco Museum of Modern Art, 11 October 2008 - 4 January 2009

After a whole century has passed it seems that X-ray images can still be captivating even in the age of digital saturation. But it is interesting to consider that the Aboriginal people of Arnhem Land continue the 4000 year old tradition of ‘X-ray style’ rock painting.  This is where natural or spiritual beings are depicted with the viscera and skeletal structures clearly visible through the external outline, and these works represent sacred ancestral images and important food sources. According to Jennifer Wageli on the Metropolitan Museum of Art website, after European contact some paintings illustrated rifles with bullets visible inside. The Arnhem Land people had developed a sharp, imaginative and perceptive technique in order to record knowledge through observation, a process of understanding the world around them, their role in it, and a celebration of life. I makes me wonder how the Europeans interpreted this ‘style’ of painting if they encountered this work before X-ray became a household term, and how they would have understood the concept of visualising invisible interiors without the context of Röntgen’s discovery.

Posted in research | 2 Comments

new revolutions…

Hounsfield's sketch

In 1967 an idea occurred to Sir Godfrey Newbold Hounsfield (1919-2004), a brilliant English electrical engineer, that one could determine what was inside a box by taking X-ray readings at all angles around the object. Prior to this he was involved the development of early computer technology where in the late 1950s he had lead a team that built the first all-transistor computer to be constructed in Britain, the EMIDEC 1100. Combining his knowledge of computer technology and his interest in automatic pattern recognition, Hounsfield’s realisation lead to his invention of the computer tomography (CT or CAT) scanner. Bizarrely his invention is also attributed as a direct result of the Beatles booming record sales in the early 1960s. It turns out that the EMI record company, an arm of the EMI Group (Electric & Musical Industries Ltd) also owned the Central Research Laboratory in London of which Hounsfield was an employee. Benefiting from the Beatles lucrative success EMI was able to fund Hounsfield’s pioneering work on this scanning devise for which he was awarded the Nobel Prize in 1979. EMI produced and marketed the first commercial scanner. (principles of Biomedical Infomatics Ira.J.Kalet, Academic Press Elsevier 2009 pg 44-45 )

ANU XCT Facility micro-CT scanner.

Since then computed tomography scanning has revolutionised medical imaging and diagnostic radiology methods; we are now familiar with the images of body parts in thin slices. More slowly technology entered research laboratories, particularly those focussed on the structural studies of materials. While simple realisations of the internal structure in rocks, fossil and animals proceeded for many years, the novel developments of tomography such as 3D micro-CT were imagined but not fully realized until a major revolution in computational power. Now supercomputers make it possible to image high-resolution volumetric data quickly, so this nuclear optic technology is advancing at a rapid rate. The microcomputed tomography in the ANU Department of Applied Mathematics is a modern day extension of Hounsfield’s CT and computers, only this new technology give us the ability to visualise a full dataset extremely quickly.

movie of work in progress bean in 4 revolutions

work in progress, animation in 4 revolutions - hyperlinked: click through to movie

Each micro-CT dataset of the growing mung bean is one revolution, a full 360 degrees. Andrew Kingston has processed more revolutions from every three steps so I can put them together as an animation and have a look at how this project is going to work as a sequence of successive revolutions over the nine-hour period. 3D micro-CT is tomography created through computer processing of digital geometry to generate a three dimensional image of the internal and surface areas of a static object X-rayed around a 360 degree rotation on a fixed axis. It results in high resolution 3D volumetric data represented by voxels or points mapped within x, y and z coordinates, a single dataset can contain up to twenty gigabytes of information. This is what gives me the full volumetic image of the bean seed.

Portraits in the tea room. A small selection of the many characters from the ANU Department of Applied Maths, as a painting of each other.

I’ve tried to understand this process a little more. While I’m just an end user I think it important that I familiarise myself with this technology and how it works. I’m privileged to work with the team at Applied Maths. They all have brilliant minds and slowly as I get to know them better I find out that they have done something extraordinary; discovered something, worked on a groundbreaking project or won some major award, yet their achievements remain understated. As a Department they are very inclusive, fun, enthusiastic and it so amazing the way they put up with me hanging around and share their ideas. Conversations vary and I often get a full explanatory diagram drawn on the white board; such as the instructional chat I had with Adrian about the physics of heat loss in a cup of coffee – does it cool quicker with milk in or not? – or the theory and process involved with the technology they are using so I can get up to speed with my project.

M.Turner, G.Myers, A.Kinston, B.Young (standing) and T.Varslot

The people I have most contact with in regards to the XCT, apart from Tim Senden is the group in this photo, Michael Turner, Andrew Kingston, Glen Myers , Trond Varslot and includes Ben Young (from Digital Core). They make up part of the group that are looking at Dynamic XCT which is an image in 4D (3D + time). This major project is confidential as they are looking toward establishing a patent for the rapid acquisition of data in 4D. They would have to kill me if I told you about it. Luckily for me it is so complicated that there is little chance of me ever understanding the technical aspects of it, so I am no great risk …

Andrew Kingston briefing the troupes

Recently Andrew and Trond gave a presentation to the department on the research they have been doing in regards to the software that interprets and represents the tomography images, mostly of rock core samples around 5mm in diameter. It gave me a better understanding of what they are working on in terms of image resolution. Because the object is scanned by a cone of X-ray as it rotates 360º, there is a distortion of the resulting 3D data. Because of this they are developing software to correct the data so that it becomes a true volumetric representation of the original sample.

pinhole cameral negative 1986

To comprehend I correlated this idea to making pinhole cameras in first year photography; placing fresh light sensitive paper in the back of a shoebox, finding a subject in the light, unveiling the pinhole, capturing the image by guessing the exposure time, stopping the pinhole and racing back in to the dark room to develop the negative. My images were fairly rudimentary, resulting in circular images shaped by the light refracting inside the box through the pinhole. A small section in the middle of the image is in focus but bleeds out of focus toward the edges. The way I can understand Tron’s and Andrew’s software is that if you pretended to use their software to process these old pinhole photographs, (if you imagine that the paper stores the image as data) their software would rectify the data at the edges and bring the whole image into crisp focus. Another way for pixel people, like me, is thinking of the problem as you would in Photoshop. Imagine you have an even grid of lines and you overlay another grid of lines that have been spherised in the distort filter tool. Only the middle to the two grids align exactly. You would need to use the transform tool to rescale the warped grid to match exactly the even grid behind.

mung bean seed germinating - work in progress

Of course using the example of a shoebox pinhole is a dreadful over-simplification considering they are looking at 360º volumetric datasets with applied mathematics, but its interesting to note that with this software they can now look at old data sets that predate the software and rectify them in the same way. But it is not a simplification to admire 3D micro-CT scanners as an advanced form of digital photography, because that is what they are. They use light – which in this case is X-ray – to capture the information that makes up an entire object, and it records this information through a tightly packed core of optical cables. The tricky bit after data collection is the reconstruction or synthesis of this data into a 3D image, and then the segmentation which is the interpretation of this 3D image by a computer. These phases are important so as to differentiate the various aspects of data such as solids, liquids, gas or air, as a process of improving the clarity and contrast of the data.

All this combined results in these images of a sprouting bean.

Posted in project | Leave a comment

3D or not 3D…

Andrea Pozzo, fresco painting on the ceiling of Sant'Ignazio, Rome, 1685-1694

Recently on ABC TV they ran a 3 part series, Baroque!, with art critic Waldemar Januszczak. In the first episode he discusses Andrea Pozzo’s (1642-1709) anamorphic fresco on the flat ceiling of the Roman Jesuit Church of St. Ignazio. It depicts heaven opening up into an endless space but for an observer it is only possible to benefit from the full trompe-l’oeil effect if you are standing in the correct position, marked on the floor, from below. It is a triumphant masterpiece employing the trickery of depth through perspective, and I thought it was interesting when Januszcak commented on the intended impact of this illusionary vision as not dissimilar to the sensory transportation into the fantasy worlds of online gaming devises such as Second Life. It made me start thinking more about our collective fascination with 3D; considering that 3D display TV is threatening to soon become domesticated, a commercial venture apparently driven by sport, not cinema.

The Incredible Hulk appearing in stereoscopic line art. The Hulk was created c 1962 by, Stan Lee & Jack Kirby. Shy physicist Dr. Bruce Banner is transformed into The Hulk after he is accidentally radiated by a detonated gamma bomb of his own invention, making his life extremely complicated.

I’ve always been a fan of stereoscopic imaging and used to collect comics for that excellent gimmicky effect. A fantastic example of stereoscopic photography I’ve enjoyed recently is the installation of Frank Hurley’s original images of Mawon’s Antarctic expedition, reconstructed by Peter Morse and Paul Bouke at the Tasmanian Museum and Gallery. But I’m showing my age now when I opt out of sitting in a cinema for two and half hours with the kids to watch 3D block busters, convinced I’ll get a migraine. But one of questions I am most asked about in context of my work using 3D microcomputed tomography, what is really 3D about it if we aren’t wearing optical goggles to view it through? I haven’t yet made work with stereoscopic imaging which is possible at Vizlab and with Drishti, and I do find it hard to describe what a true 3D volume is to the non-believer.  I am uncomfortable talking about volumetric pixels or x, y and z coordinates as my natural habitat is the flatlands of bitmaps; although Drew teased me the other day for casually discussing clipping planes in the tea room with Ajay.

Artist Denise Higgins experiencing stereoscopic images of volume rendered data at Vizlab

A few weeks ago Tim invited me to meet with a group of people at the ANU who were meeting for the first time to talk about 3D imaging. The group comprises of researchers from a wide range of disciplines, physics, paleontology, maths, archeology, but they are all in some way being required to visualise their data in 3D volumes, or perhaps are thinking about ways that 3D volume data or microcomputed investigation would extend their research. The group has formed specifically to share knowledge, network and seek information about what kind of imaging or data technology would best suit their projects. While the concept and abilty of 3D volume and imaging has been around for some time, with the rapidly advancing capabilities of software and programming there are many available options to specific research projects, but at what extent is the computational imaging or process relevant?

Dr Vincent Daria explaining his Holographic Neurone Stimulator which he custom built for this collaboration.

They decided as a group that the best way to start networking is to visit each other’s research areas or suggest other sections that work with or develop research through 3D imaging.  So I joined in on the excursion to visit the physicist Dr Vincent Daria and his Holographic Neurone Simulator in the John Curtin School of Medical Research. The new building, if you haven’t been, designed by the architectural design firm Lyons, is clad in digitally formed precast concrete panels illustrating four areas of School’s research; from the scale of the human body/humankind to the cellular, the DNA molecule and the chemical bases which make up the DNA molecule represented by, A, G, C and T. Down into the depths of the building we were led until we came to a windowless room. Here Vincent has built this microscope which probes the miniscule neuron’s of rats brains with laser beams to activate the electrical impulses of the dentrites to see how these nerves process information.  He gave us the most amazing demonstration of laser controlled manipulation of yeast cells suspended in water using dynamic optical tweezers.  On top of that his two-photon microscope can image neurons in 3D in preparation for holographic photostimulation of caged neurotransmitters. This instrument is the result of a collaborate project with two neurobiologists, Dr. Christian Stricker and Prof. Steve Redman and physicists Professor Hans Bachor and Dr Vincent Daria. Perhaps the result is a true transdisciplinary event, rather than an interdisciplinary one.

What brought them together were the limitations of conventional methods of experiments using electrode stimulators to activate brain cells in order to understand the complex structures of billions of individual neurones that make up a brain, in this case the humble lab rat, but like our own. What they wanted to achieve was an advanced system that could generate images of living neurones in real time and in 3D while stimulating the neurones in specific points. Keeping the tiny, thin slice of brain alive in liquid, they employ a  programmable light projection of a hologram to create ‘bright spots’ to stimulate precise sections of the neurone to initiate an impulse, the pattern or light direction can changed or relocated within milliseconds. (image to come I promise!).

Four-dimensional optical manipulation of colloidal particles. Peter John Rodrigo, Vincent Ricardo Daria, and Jesper Glückstad. Optics and Plasma Research Department, Risø National Laboratory, DK-4000 Roskilde, Denmark http://www.ppo.dk

I found it hard grasping or visualising microscopic 3D holography in this context because not only did it require my own brain to understand the laser technology and the concept of caged cells, I found myself in brand new territory trying to conceptualise the purpose for which this technology is employed in neuroscience. At some point I felt I had fully achieved the sensation of Alice falling down a rabit hole.

So this week I contacted Dr Daria to ask if it was OK if he could take me through it again, and very kindly he did. He spent almost two hours patiently explaining to me the principles of optical physics, the difference between wave frequencies such as femtosecond-pulse and expanded lasers, and the different effect red and blue light sources have on cells, and how this all relates to the holographic confocal microscope and the optical tweezers. He also showed me where they prepare the little brains. They have a slicing device like a mico deli ham shaver, and I got to view some delicate, tiny grey slices being kept alive in a glass vial of aerated liquid. This was important for me as one of the issues I had was visualising what a thin slice of rat brain actually looks like – having never dissected one at school. We also talked about how the research could lead to a better understanding of how the brain works and perhaps one day, hopefully, will lead to simple cures for chronic neurological disorders or even mental illness.

Posted in excursion, research | Leave a comment

tank girl…

The Department of Applied Maths is situated in a group of buildings spanning Cockcroft and Oliphant at the back of the ANU, looking out toward the mountain range beyond Lake Burley Griffin. Beside Cockcroft stands the forty meter Heavy Ion Accelerator Tower. While the structure itself is architecturally unexceptional, it is a personal landmark as I drive around Black Mountain on Parkes Way, or ride along the lake. Knowing that the tower has a function central to research in the Nuclear Physics Department, I have never thought to ask what is inside the tower, so it is a surprise when Tim Senden tells me we are going on a mystery tour. We meet with Dr Nikolai Lobanov who is the Engineer Officer in the Department of Nuclear Physics, and he hurries us into the main building which houses the particle accelerator. Not only does Nikolai move fast, he speaks quickly with a classic Russian accent. He ushers us into a lift that hasn’t seen a refit since the facility was commissioned in 1974, and it doubles as a small museum full of photos and documents regarding the accelerator. As I’m not sure where I am being taken or what a particle accelerator looks like, it is with some trepidation that I commit to squeezing my butt through a small, round submarine like hatch.

Tim Senden sliding into into the tank hatch

We enter into a cramped, dark, circular chamber with a very low ceiling. Lit only by a couple of  fleuro tubes, the tour begins with Nikolai generously explaining the function of all the components making up the accelerator before us. While I understand about every sixth word it is obvious Tim’s super brain is taking it all in. I learn that the complicated apparatus before us is constructed of thousands of ceramic disks that fit together in a way that that no metal components touch. But not yet realising we are situated at the top of the tower, it is disorientating when the metal floor begins to descend. I discover that we are actually suspended on a metal platform inside a huge concrete tank, like the interior of an enormous nuclear warhead, causing me to think briefly of Stanley Kubrik’s Dr Strangelove (How I Learned to Stop Worrying and Love the Bomb). The accelerator is the long, shiny central column encased in thousands of metal hoops, around which the platform, a donut shape, moves up and down, enabling access to the technicians who periodically service the accelerator. It can only be entered when the tank is emptied completely of the sulphur hexafluoride gas used to insulates the accelerator under high-pressure. The steel and ceramic components can be replaced ingeniously in sections even though they are all pieced on top of each other for twenty meters. Nikolai takes a Polaroid of us to add to the collection of intrepid tank visitors; few people get to access the interior; this even being Tim’s first time so I feel incredibly privileged, noting the small rows of signatures on the wall above the top hatch. The only other hatch is at the bottom so if you get stuck half way it would be a bit of a bother to get out.

observing the top of the tank as we descend on the platform.

Before we set off on our journey down the accelerator, Nikolai points out to us the marks from arcing on the ceiling. It’s the only physical evidence to a non-scientist of the power of this mighty apparatus. What the heavy iron accelerator produces is speeding particles in order to probe the nature of matter. It speeds up charged atoms to ten percent of the speed of light and then these speeding ‘bullets’ can then be used for a range of studies, including some high powered materials science. The ANU’s accelerator is one of the world’s largest Van de Graaff generators – you know those mad balls that create enough static electricity to make your hair stand on end – but it has the capacity to generage enormous voltages of 15 million volts and more. This level of voltage is used to accelerate charged particles (ions) sufficiently to overcome the strong electrostatic repulsion between atomic nuclei (which are positively charged so they repel), allowing the study of one of the fundamental but least understood forces – the strong nuclear force.
 The particle accelerator supplies high energy ions for a variety of purposes ranging from studies on the structure of the nucleus, interactions between nuclei, materials science, global climate change, bio-medicine, archaeology AND of course, the XCT facility.

Dr Nikolai Lobanov pointing out some of the details to A/P Tim Senden

As Nickoli points out to us the twenty meters of nylon and steel chain that whir around at a speed of over 50 km per hour, I try to envisage the sub-atomic world of the nuclei, speeding around and repelling as positive and negative charges. I can’t help but consider Marcel Duchamp’s The Bride Stripped Bare by Her Bachelors, Even (The Large Glass) (1915-1923). Duchamp was preoccupied with concepts such as radiation, X-ray, electricity, electromagnetism and radio waves and this particular work encompasses many of these themes as a way of describing the rapidly changing world of technology, science and social relations at the beginning of the 20th Century.

There is much of the intricacy of the accelerator that reminds me of the aesthetics of the Large Glass, if not the concepts of speeding particles. Perhaps it is an artistic simplification but for me the corresponding themes resonate. The discovery of the atom and the development of nuclear energy has played a major part in shaping our society and modern culture; the products of which motivates my own art practice.

Marcel Duchamp, The Bride Stripped Bare by Her Bachelors, Even (The Large Glass) (1915-1923). Philadelphia Museum of Art collection.

As an artist utilising X-ray technology I think it is important to refer to Duchamp (1887-1968) who referenced the new discoveries of science and technology in many of his artistic projects. Duchamp was born into an era where new discoveries concerning the nature of matter and energy rapidly succeeded one another and were widely publicised in the popular press. After X-rays came radioactivity and subsequently, the development of practicable wireless telegraphy, allowing undreamed-of communication over great distances. There is a fantastic book by Lynda Dalrymple Henderson, Duchamp in context: science and technology in the Large Glass and related works, (Princeton University Press, New Jersey, USA, 1998). According to Henderson, The Large Glass, ‘can be recognised, as it should be, as a remarkable synthesis of contemporary ideas that stands as one of the great monuments of early twentieth-century art and culture.’ (Henderson p. xxiii). Each part of The Large Glass has particular significance to the overall concept including the eight-year period in which it was constructed. Duchamp even referred to this extended development as a delay, one of many metaphors he used to describe scientific endeavor.  As a model for scientific thought, The Large Glass also beautifully integrated into its historical narrative the added possibility of uncontrolled circumstances such as the shattered glass. For Henderson, to understand The Large Glass is also to be able to understand the history of science as it emerged and shaped the modern world.

Painting could no longer express all of these ideas for Duchamp so he created the structure of The Large Glass with oil, varnish, lead wire, lead foil, mirror silvering, and dust on two panels (cracked), all sandwiched between two glass panels, held in a steel frame which stands at  277 cm high x 176 cm wide. In responding to new ideas Duchamp transcended traditional concepts of perspective in 2D painting to 3D sculpture, and experimented with transparency through the use of glass.  In his own words he described The Large Glass as constituting, ‘ … a rehabilitation of perspective, which had then been completely ignored and disparaged. For me perspective became absolutely scientific.’ (Henderson, p. 38)  This work requires further interpretation in context of Duchamp’s numerous notes which he released in box sets over the years until the 1960’s. Duchamp could use contemporary developments in electricity and electromagnetism, for example, to comment playfully on sexual relations, without any pretence of discovering new principles of physics. (p. 74). The theme of collision between the Bride and the Bachelors which recurs in Duchamp’s notes is just one of many clues to the first part of the title. According to Henderson this aggressive situation is a demonstration of Duchamp’s penchant for analogies when cross referencing disciplines and it ‘is very likely rooted in the alchemical imagery of stripping and purifying metals before they are symbolically united as bride and groom.’ (p. 86) The imagery in his notes about collision relate to physics and chemistry in their formal language, ‘and perhaps more specifically to the high speed electrons and radioactive particles often described in terms of speeding projectiles and bombardment.’(p. 86).

The ANU Heavy Ion Accelerator or 14 UD accelerator

It is with a new perspective I can now observe the tower through it seemingly ordinary exterior, as if with X-ray vision. I can visualise the vertical tank and imagine the activity of all those nuclei travelling about and see the multitude of wires, conductors and beamlines that make up the tower and the enormous facility branching out below.

Posted in excursion, research | Leave a comment